Logo

Extensions

  • Extensions Overview
  • Links to 3rd Party Extensions

Core Extensions

  • Audio
  • Browser Extensions
  • Content Browser
  • Extensions Manager
  • Hotkeys
  • Layers
  • OmniLive
  • Movie Capture
  • Pivot Tool
  • Property Panel
  • Saved Layouts
  • Snap Tool
  • Stage
  • Version Control
  • Viewport

Material Extensions

  • Material Graph
  • Material Mapper
  • MDL Distill and Bake
  • Substance SBSAR Support
  • USD Material MDL Export

Bridges

  • Houdini Engine HDA Loader (Alpha)
  • Modulus Extension
  • Onshape importer
  • Reshade
  • Substance 3D Painter Link

Simulation Extensions

  • Overview
  • Blast Destruction
  • Boom Collision Audio
  • Fluid Dynamics
  • Force Fields
  • OmniPVD - PhysX Visual Debugger
  • Particles
  • Physics Core
  • PointClouds
  • Vehicle Dynamics
  • Zero Gravity

Product Configurator

  • Product Configurator

Synthetic Data

  • Replicator

Animation Extensions

  • Animation
  • Animation Stage Recorder (Beta)
  • TimeSample to animation Curve
  • Animation Graph
  • Motion Path (beta)
  • Animation Retargeting
  • Audio2gesture
  • Navigation Mesh
  • Pose Tracker
  • Sequencer

Design Extensions

  • Array Tool
  • Design Render Settings
  • Distribute Tool
  • Measure Tool
  • No Code UI
  • Paint Tool
  • Playlist Manager
  • Randomizer Tool
  • Screen Capture
  • Section Tool Extension
  • Sun Study
  • Surface Instancer
  • Variant Editor
  • Variant Presenter

Streaming Extensions

  • Omniverse Streaming Extensions
  • WebRTC Browser Client
  • WebSocket Browser Client
  • Augmented Reality

Programming Extensions

  • Command History
  • Console Extension
  • PIP API
  • Python Scripting Component
  • Script Editor
  • VS Code Link
    • Enable the required extensions
    • Configure your project for debugging
    • Start the debugger
    • Set a breakpoint
    • Trigger the breakpoint
  • Warp (Preview)

Digital Twin Extensions

  • Patch Manager Extension

Omnigraph

  • OmniGraph

AI Toybox Extensions

  • Overview
  • AI Animal Explorer Extension
  • GANverse3D Extension
  • Inference API Extensions
  • Machine Learning Library Extensions

Utility Extensions

  • 3MF Converter Extension
  • Asset Converter
  • Asset Importer
  • Asset Validator
  • Collect Asset
  • Entity Spawn
  • ExtendedSearchField
  • GeoJSON Converter Extension
  • Geometry Streaming
  • Hotkeys
  • Layouts
  • Metrics Assembler
  • Open Geospatial Consortium (OGC) Map Tile Loader Extension
  • Profiler Window
  • Tracy profiler
  • QuickSearch
  • Scene Optimizer
  • SimScale Converter Extension
  • Tagging Extension
  • USD Collections Extension (Preview)
  • USD Curve Rendering Support
  • USD Paths
  • Waypoints

Learning and Feedback

  • Omniverse Glossary of Terms
  • NVIDIA On-Demand Video List
  • Documentation Fix Request
  • General Feedback

Licenses

  • NVIDIA OMNIVERSE LICENSE AGREEMENT
  • SOFTWARE SUPPORT SUPPLEMENT
  • Other Licenses
  • Data Collection FAQ
  • Cameras
  • Preferences Panel
Omniverse Extensions
  • »
  • VS Code Link
  •  

VS Code Link

This tool enables the connection of an Omiverse app to VS Code’s python debugger by using the python ptvsd module. See PTVSD docs and VS Code docs for detailed information on these tools.

Note

The following example assumes you’re familiar with creating an extension and you have VS Code installed. For simplicity, this example will use a new, unmodified Extension Template Project

Enable the required extensions

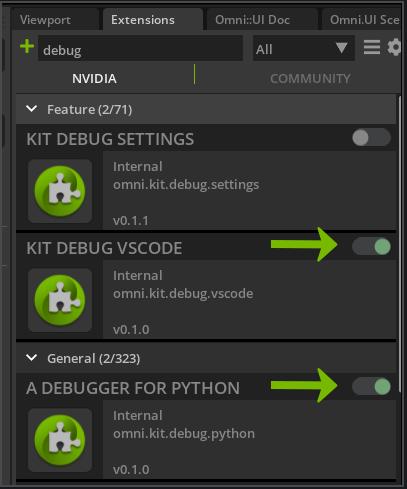
To debug a python extension in VS Code you must first make sure that the Kit Debug VSCode and A Debugger for Python extensions are enabled.

Enter “debug” into the Extensions filter to find them quickly

_images/ext_vscodelink-enable-extensions.png

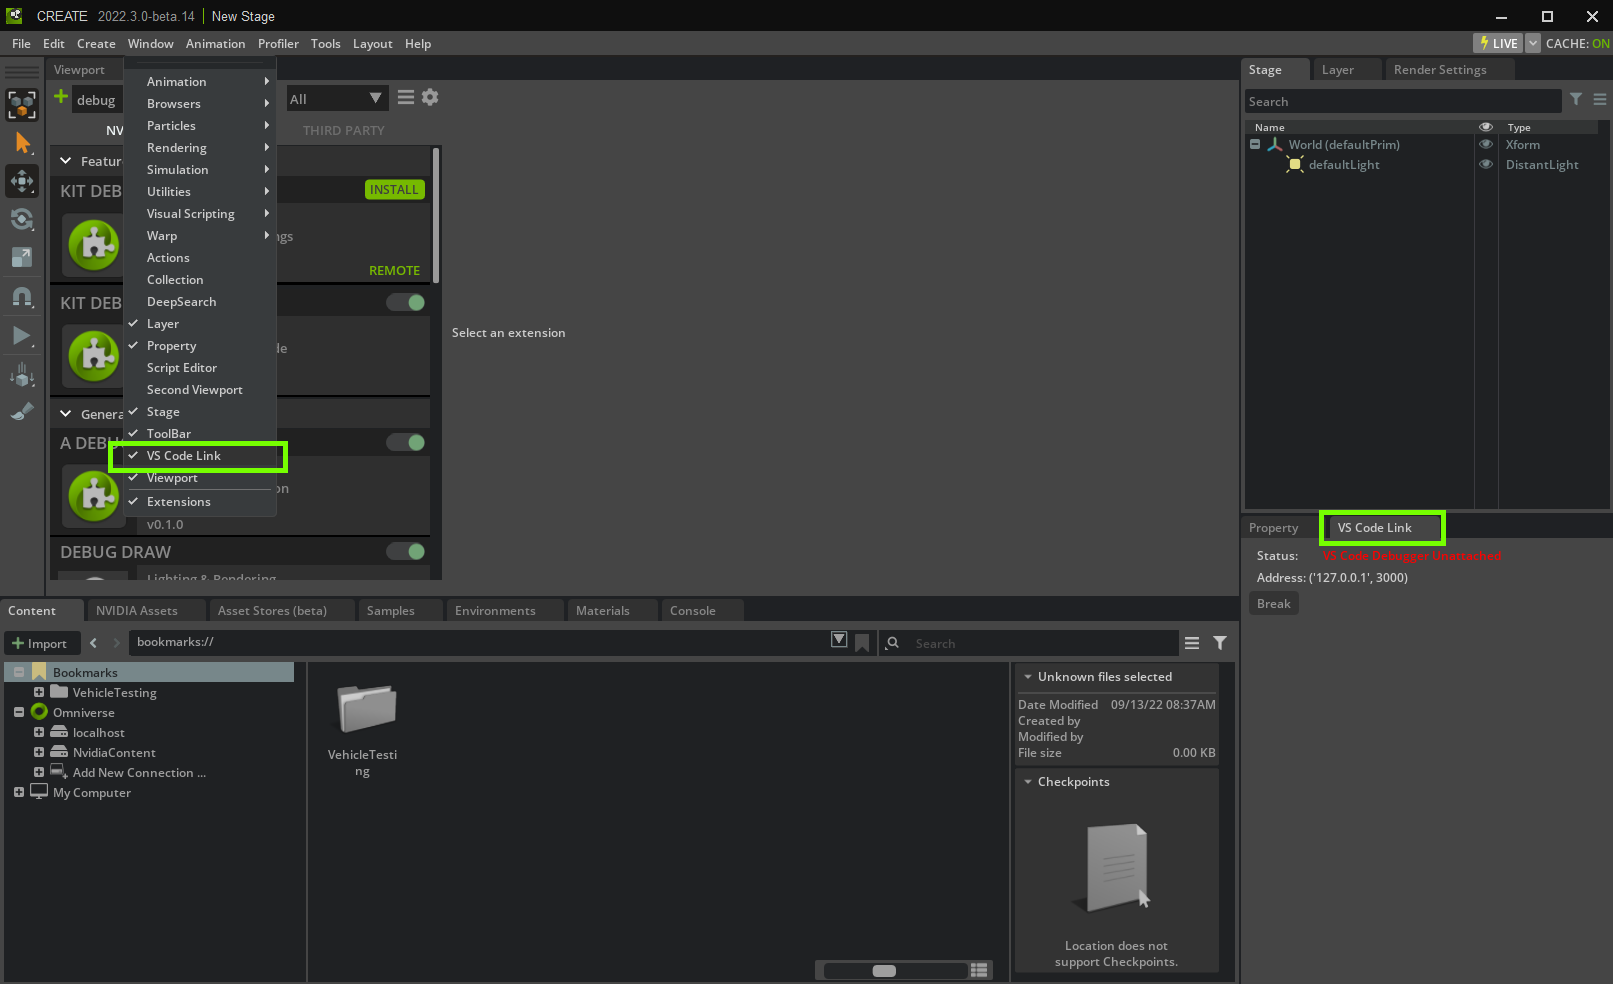
In Omniverse Code, the VS Code Link’s window is located next to the Property window. If you don’t see it, make sure the VS Code Link entry is checked in the Window menu. Notice that VS Code Link currently says it’s unattached (in red).

_images/ext_vscodelink-windowpanel.png

Configure your project for debugging

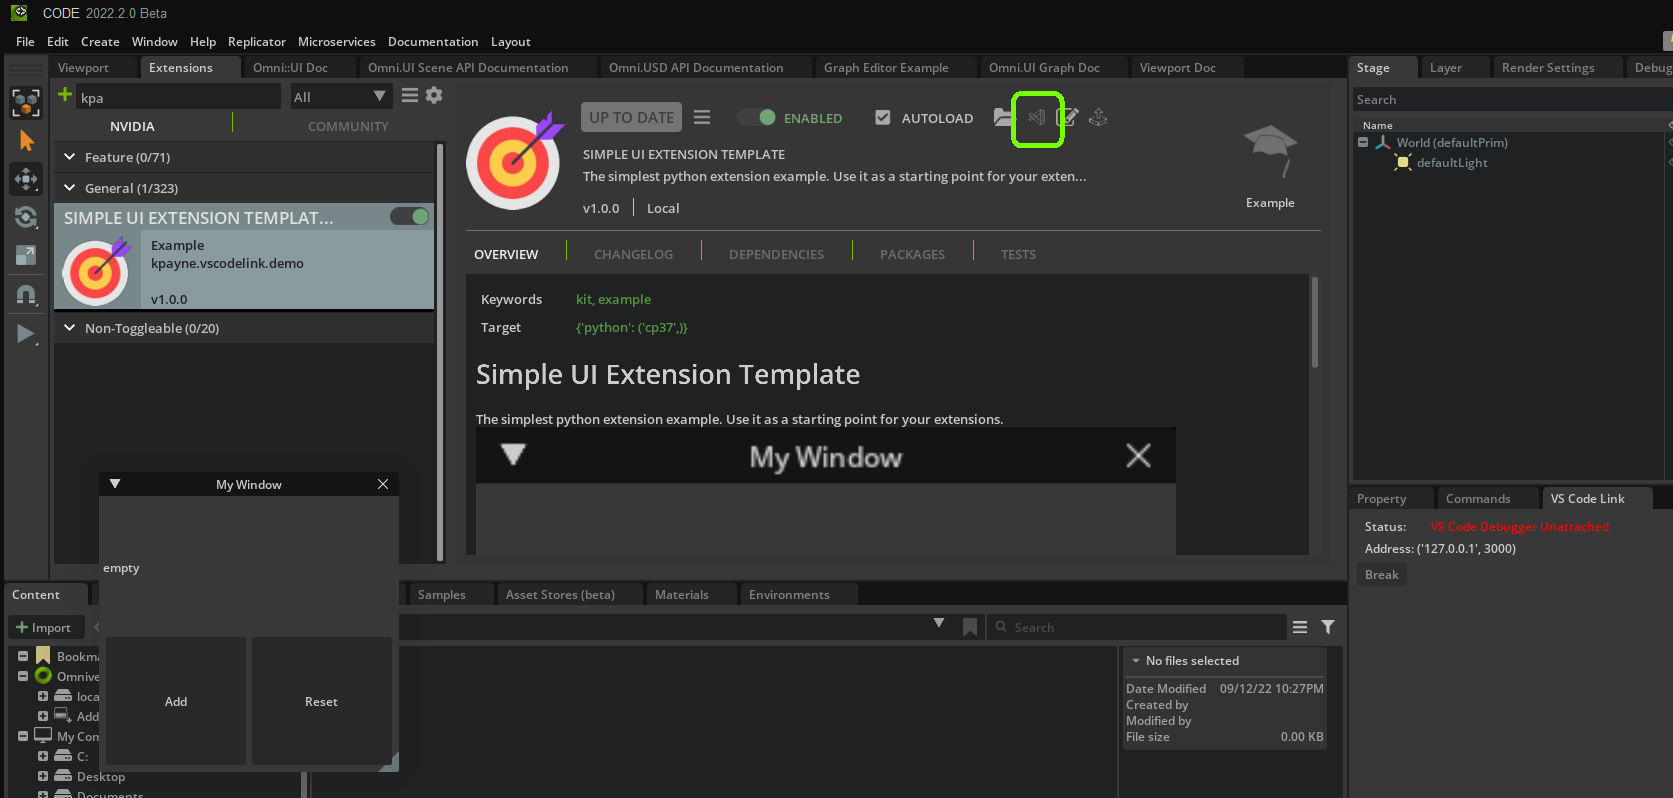
Now open your extension’s project folder in VS Code. An easy way to do this is by having your extension selected in the Extensions window and then by pressing the VS Code icon in the extension information area.

_images/ext_vscodelink-open-in-vscode-button.png

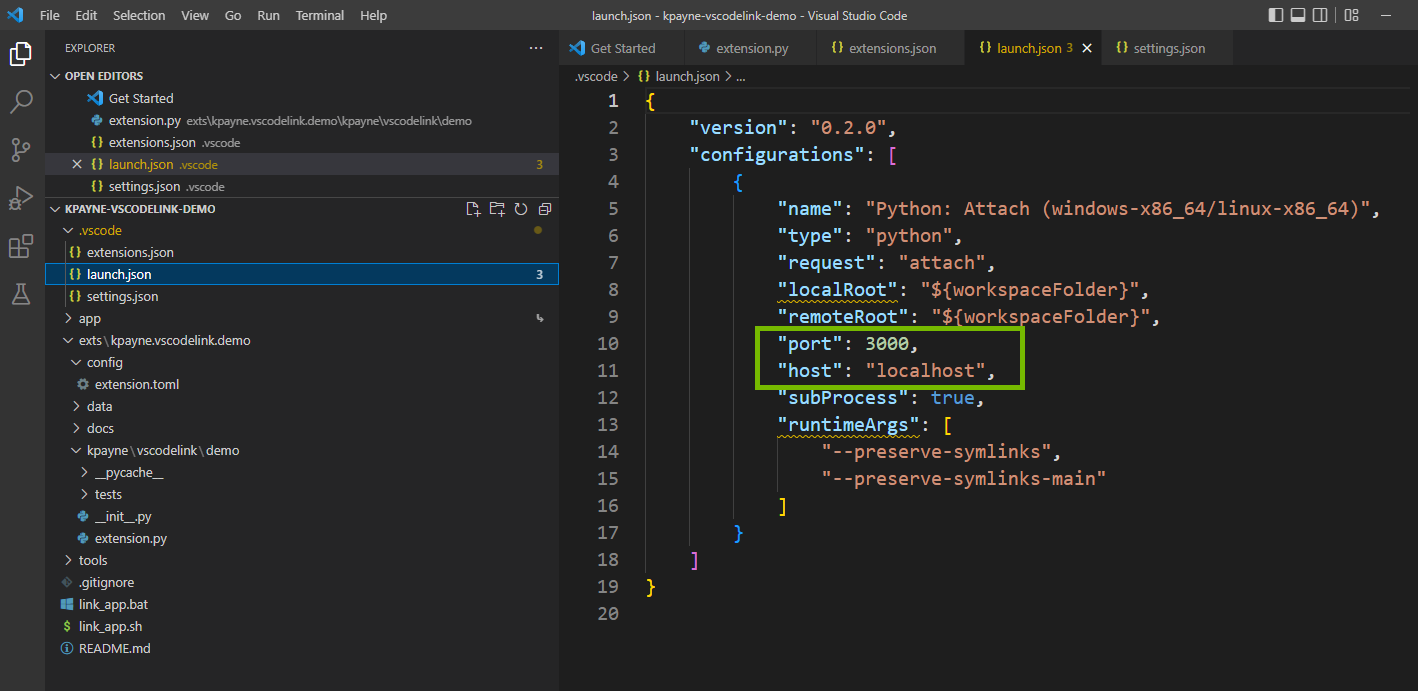
Verify the configuration settings in launch.json are the same as the Address in the VS Code Link window (127.0.0.1 is the same as localhost). The file should look like this, unless it’s been modified.

_images/ext_vscodelink-launch-json.png

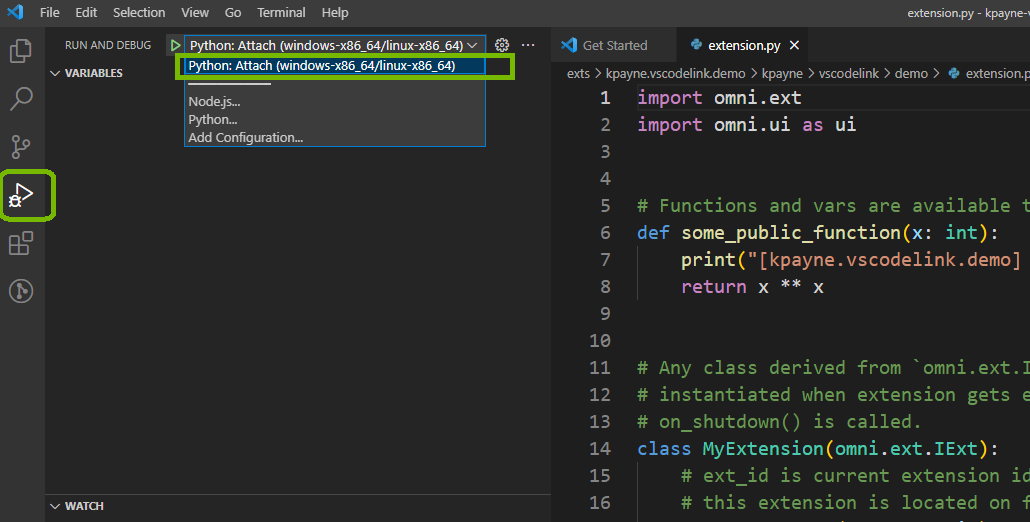
In the left margin of VS Code, press the Run and Debug button to show the debugger. Make sure “Python Attach” is selected in the debugger configuration drop-down list. This configuration tells the debugger to attach itself to an existing process, since the extension is already running in the Omniverse app.

_images/ext_vscodelink-select-run-and-debug.png

Start the debugger

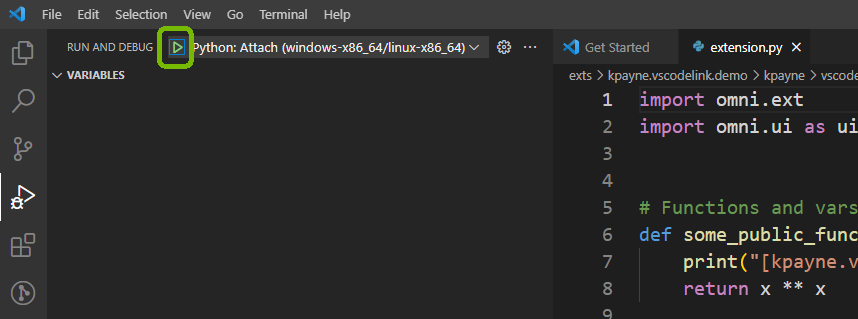
Now press the Start Debugging arrow, next to the debugger configuration drop-down list, to start debugging

_images/ext_vscodelink-start-debugging.png

Set a breakpoint

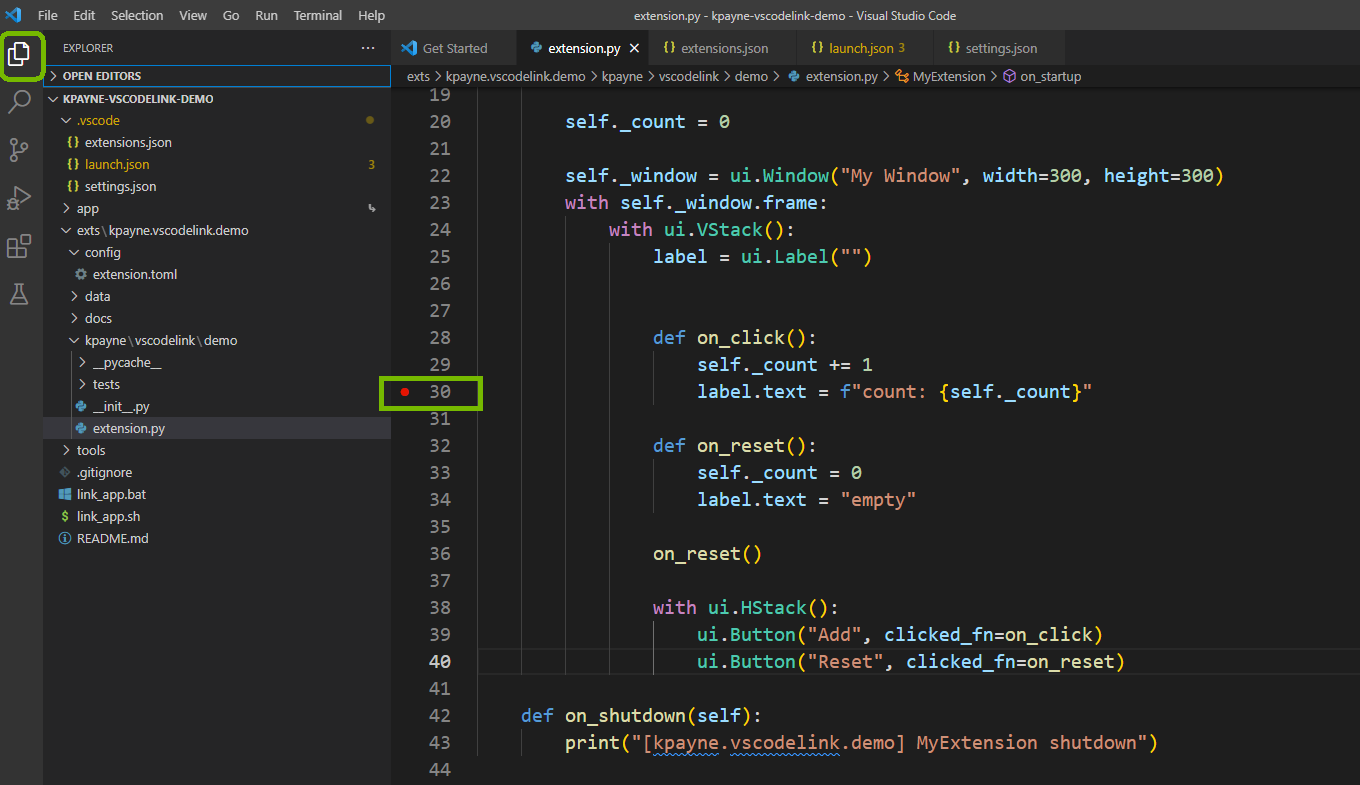
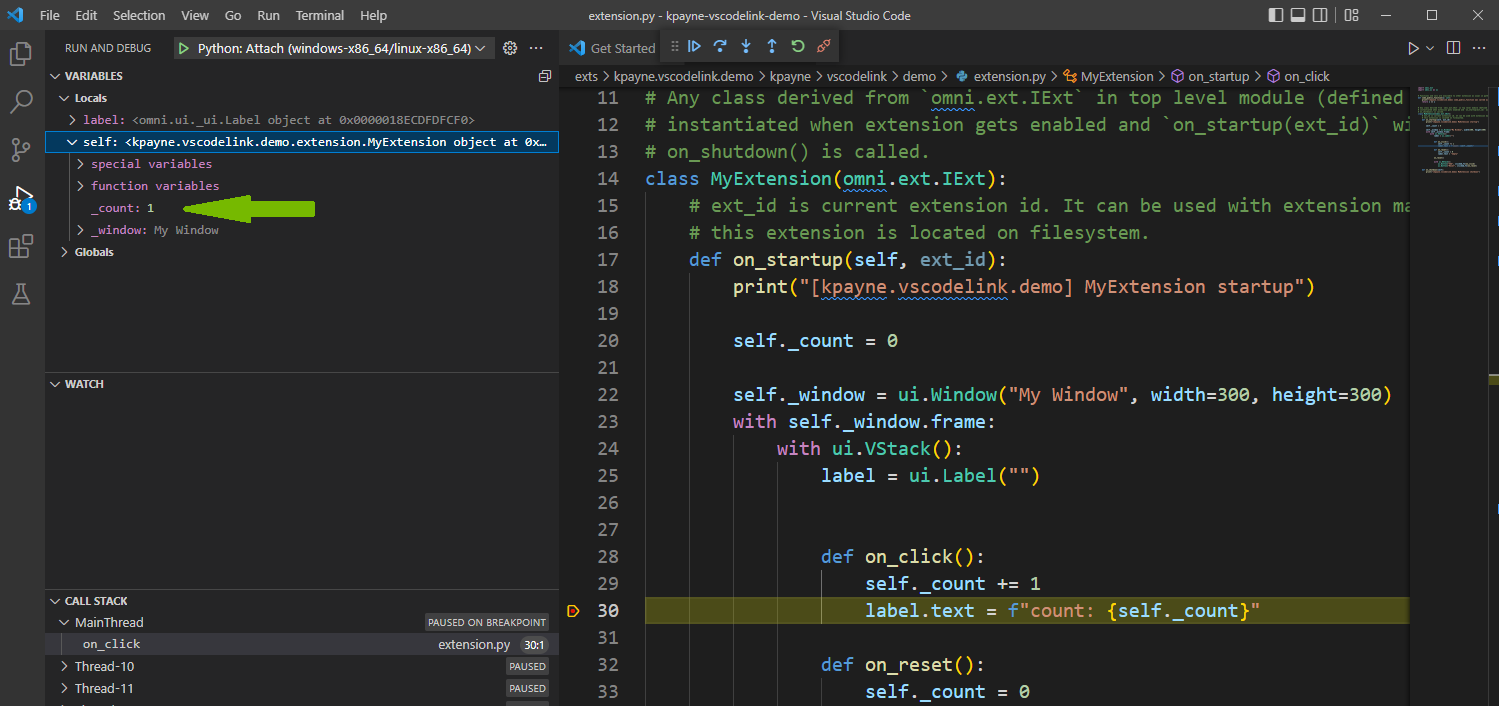
Go to your extension’s extension.py and set a breakpoint that’s easy to verify. You set the breakpoint by clicking in the margin left of the line number (red dot in picture below). In this case the Add button’s on_click(), on line 30, is ideal. This will let _count get incremented before the breakpoint is hit so we can verify the results.

_images/ext_vscodelink-set-breakpoint.png

Trigger the breakpoint

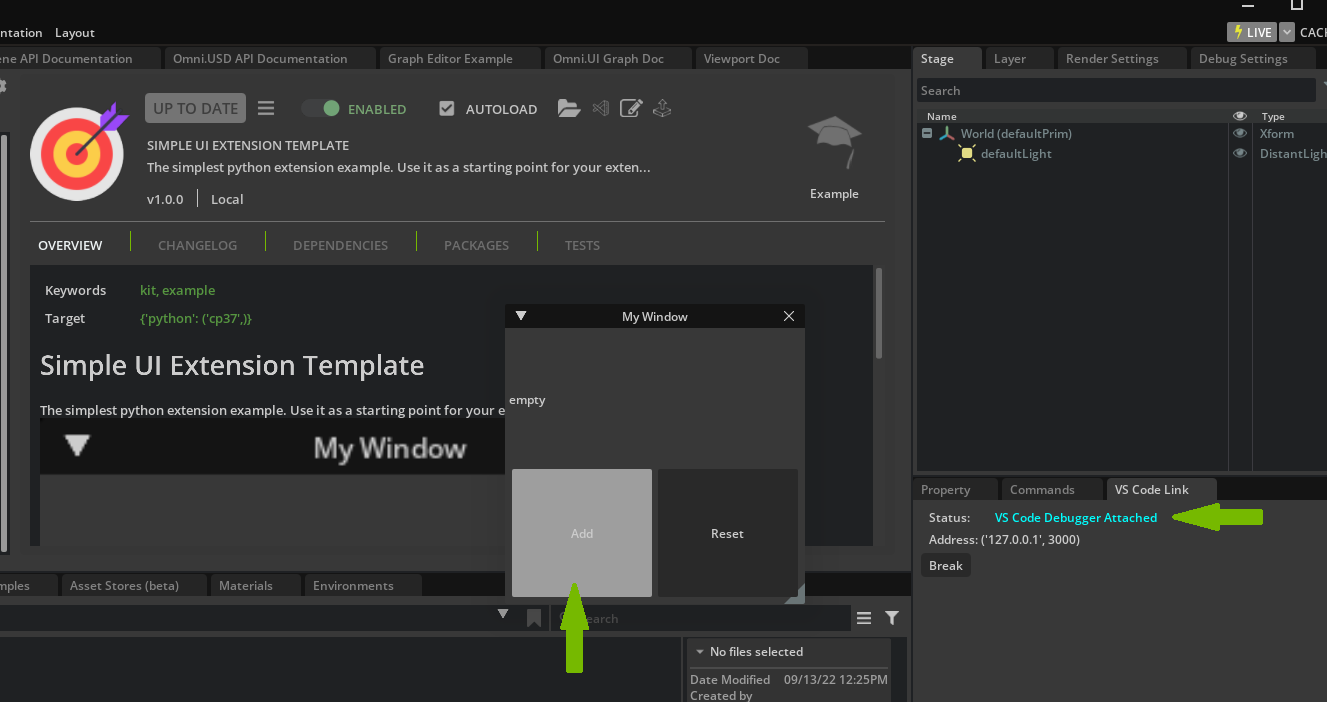
Now go back to your Omniverse app. The VS Code Link window should now say it’s attached.

Press the extension’s Add button. When it is pressed the Omniverse app should stop responding. This is because the breakpoint has paused the execution of the extension’s python code.

_images/ext_vscodelink-press-add.png

Now go back to VS Code to inspect the results. Notice that _count has been incremented to one (from zero) and the debugger is highlighting line 30 (in this case).

_images/ext_vscodelink-breakpoint-hit.png

Now your extension is linked to the VS Code debugger and you can use the usual python debugger functions.


© Copyright 2023, NVIDIA. Last updated on Sep 21, 2023.