RTX Remix Toolkit Debugging Guide#
Debugging a Kit application can be challenging since it’s not just a simple Python app that you can create a virtual
env, install libs from a requirements.txt and be good to go. The interpreter, libraries and the extensions are located
in many directories including outside the project, and it is all put together at runtime by the main process: kit.exe.
Our own
fluxandlightspeedextensions each reside inside a subdir insource/extensions.Omniverse extensions are located in many directories and only available when the app is built, such as
_build/windows-x86_64/release/extscacheorkit/extscore.
Also the “real” application will be inside the _build directory, such as _build/windows-x86_64/release/*, where the
extensions will be cross-referenced/symlinked back to the actual source/extensions directories for live editing and
hot reloading.
In a nutshell: All that goes to say that we can’t simply run a python interpreter in debug mode from an IDE, we must instead start a Debug Server inside the app and attach the beloved IDE to it.
So how do we debug?#
There are 2 recommended ways:
Omniverse debugpy based extension: Omniverse provides a handy
omni.kit.debug.pythonextension which builds on top of the debugpy library, with controls to start debug servers, wait for attach on startup, programatically trigger breakpoints on code, logging and more, and is IDE-agnostic.[Optional] Omniverse VSCode debug extension: Omniverse also provides a
omni.kit.debug.vscodeextension which extendsomni.kit.debug.pythonto show an ui window + a few features that could be handy.
Our Pycharm Professional debug extension: If you own Pycharm Professional (required since Community doesn’t allow remote attaching), it can attach to Pycharm debug servers running inside your app, and such a server is opened by our
omni.flux.debug.pycharmextension.[Alternative] LSP4IJ + debugpy: There is an extension for Pycharm, LSP4IJ, that allows the Community version to attach to debugpy servers, but it hasn’t been tested successfully yet. From the latest attempts, it attaches and stops on breakpoints but Pycharm can’t see the variables and app state.
1. Debugging with omni.kit.debug.python#
To enable the omni.kit.debug.python extension, run the app with --enable omni.kit.debug.python:
.\_build\windows-x86_64\release\lightspeed.app.trex.bat --enable omni.kit.debug.python
The app boots as usual and a debugpy server listens on port 3000. Attach your IDE to 127.0.0.1:3000.
There is also an omni.kit.debug.vscode extension that adds a VS Code Link UI window on top of the debugpy server.
Enable it via --enable omni.kit.debug.vscode or from the Window -> Extensions toolbar in dev mode.
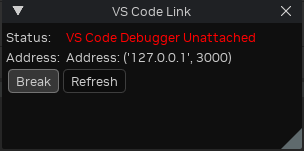
The window status changes to ...Attached when you press Refresh, confirming the connection.
See VSCode / Cursor Setup for pre-configured launch configs.
2. Debugging with PyCharm Professional#
Unlike debugpy where the app starts a debug server and the IDE attaches to it, PyCharm uses the reverse direction —
PyCharm starts its own debug server first, and the app connects to it via the omni.flux.debug.pycharm extension
(port 33100).
.\_build\windows-x86_64\release\lightspeed.app.trex.bat --enable omni.flux.debug.pycharm --/exts/omni.flux.debug.pycharm/pycharm_location="%LOCALAPPDATA%\Programs\PyCharm Professional"
See PyCharm Setup for pre-configured run/debug configs that handle this automatically.
Debugging Tests and Startup Logic#
Tests are particularly tricky to debug since they run very fast, rebooting the whole app including the debug server for each test case. Same applies if you need to debug code that runs on startup before you can attach.
The omni.kit.debug.python extension provides a break option that forces the app to wait for you to attach before
continuing:
.\_build\windows-x86_64\release\tests-omni.flux.property_widget_builder.widget.bat -- --no-window --enable omni.kit.debug.python --/exts/omni.kit.debug.python/break=1
Arguments are passed after a lone --, so they are forwarded from the .bat to kit.exe to the test subprocess.
Breakpoints won’t work otherwise. Once the app is paused, attach your IDE on port 3000.
For IDE-specific attach instructions, see VSCode / Cursor Setup or PyCharm Setup.
Quick Debug Logging#
For temporary debug output while investigating issues at runtime, use print() — not carb.log_info() or other
carb logging functions. print() writes directly to stdout and is immediately visible in the console, while carb
logging goes through Kit’s infrastructure which may filter, delay, or format messages differently.
# Correct — immediate, visible output
print(f"[MyExt] value={some_var}")

# Avoid for debugging — may be filtered or delayed
carb.log_info(f"[MyExt] value={some_var}")
Remove all debug print() calls before committing.