


Explore Your Data#
Use the Stage and Properties panels to understand an imported dataset before creating visualizations. Kit-CAE exposes the structure and values in the source file, but interpreting their physical meaning remains the responsibility of the domain expert.
Stage Structure#
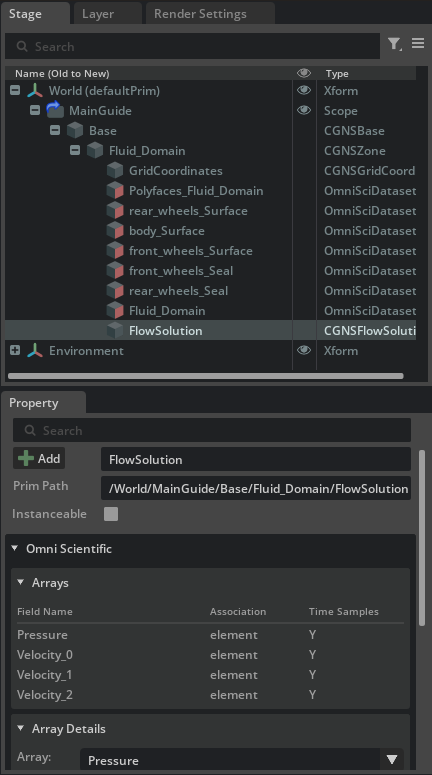
The imported hierarchy follows the source format. One file can contain several dataset prims and separate prims that own scientific arrays.
For example, the main CGNS sample contains:
GridCoordinateswith the coordinate arraysSurface datasets such as
body_Surfaceandfront_wheels_SurfaceFluid_Domainwith the volume connectivityFlowSolutionwithPressureand three velocity components
A field is listed by name on the prim that owns its array. It does not appear as a child field prim. Select the field owner to inspect all of its arrays together.
Arrays#
Select a prim that owns scientific arrays. The Arrays section in the Properties panel summarizes each field with these columns:
Field Name
Association, such as node or element
Time Samples
Select an array row to display its inexpensive metadata in Array Details, including its name, association, device, and data type.
Array Details#
Detailed statistics can require a large data read, so Kit-CAE computes them only when requested.
Select an array in Arrays or from the Array menu in Array Details.
Select Compute Details.
Kit-CAE displays its shape, range, mean, median, quartiles, and histogram when applicable. Use Histogram Range Min and Histogram Range Max to focus the histogram on an interval of interest.
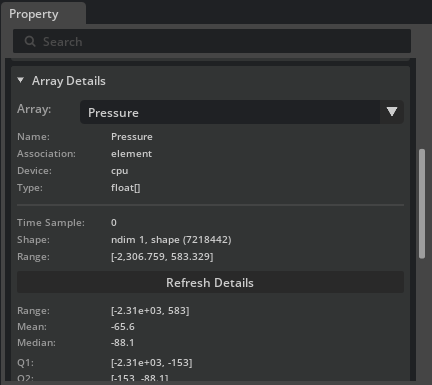
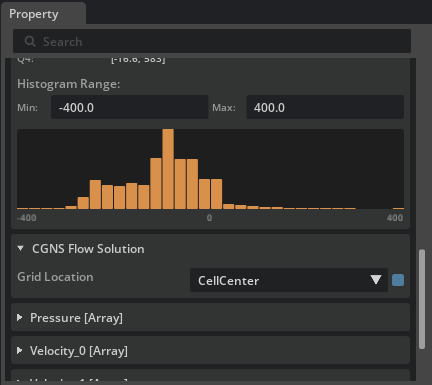
For time-varying data, changing the timeline leaves the previous result visible with an obsolete-data warning. Select Refresh Details to compute statistics for the current sample.
Array Expressions#
Use Array Expressions to create reusable scalar or vector fields from arrays on the same field-owning prim. A valid, enabled expression is evaluated on demand and appears in Arrays, Array Details, and operator field selectors like an imported field. This lets you calculate quantities such as velocity magnitude or von Mises stress, mask values, and combine fields without preprocessing the source file.
Select the prim that owns the input fields. For CGNS data, this is commonly a
FlowSolutionprim.Right-click and select Add API > CAE > Array Expression, then enter a name.
In Array Expression in the Properties panel, enter the expression. Use the completion menu to insert available fields and functions. The diagnostic below the expression reports its validity and dependencies.
For example, vec3(Velocity_0, Velocity_1, Velocity_2) combines three scalar components into a vector, while clamp(volume_fraction, 0, 1) limits an array to a selected range. An expression can also use another enabled expression on the same prim.
Display Name: Set an optional label for the derived field.
Compute Device: Leave this set to
autoto inherit the device requested by the visualization operator, or select a specific CPU or GPU.Enabled: Disable this setting to keep the expression without exposing it in array and field selectors.
Language Version: Keep this set to
1.
Note
Array Expressions operate on array values, not mesh topology. Inputs must have the same field association and number of samples. Scalar fields can broadcast across vector components; other vector inputs must have compatible component counts. For example, (128000,) and (128000, 3) are compatible, as are two (64000, 3) fields; (128000, 3) and (64000, 3) are not. Array Expressions do not calculate gradients, divergence, or other neighborhood-based quantities.
Try It: Explore the Vehicle Dataset#
Continue from Try It: Import the Vehicle Dataset.
Expand the imported root to
Base > Fluid_Domain.Inspect the surface datasets and the
Fluid_Domainvolume dataset. Their Arrays sections list coordinate or connectivity arrays.Select
FlowSolution. Its Arrays section listsPressure,Velocity_0,Velocity_1, andVelocity_2as element-associated fields.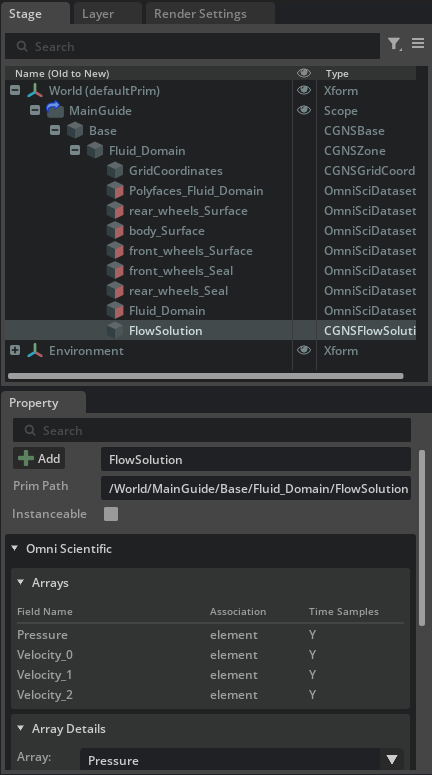
Select the
Pressurerow, expand Array Details, and select Compute Details.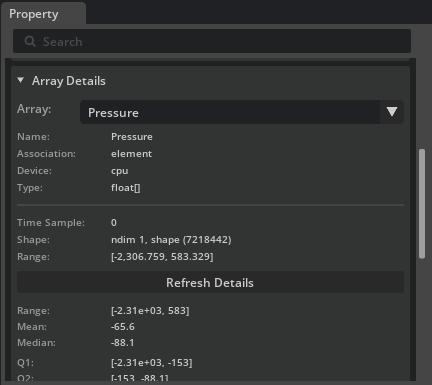
Set Histogram Range Min to
-400and Histogram Range Max to400to focus on the main pressure distribution.
Use the range shown here when choosing an iso-value or color domain later in the guide.