Explore Your Data#
After importing a dataset, use the Stage panel and Properties panel to understand the data structure before creating visualizations.
Kit-CAE provides general-purpose tools for visualizing and analyzing engineering data, but it does not interpret the physics or domain meaning of that data for you. Understanding what fields represent, what value ranges are meaningful, and how to interpret results is the responsibility of the domain expert. If you are building applications for end users, these same components can be tailored to provide domain-specific guidance within your own tools.
Stage Structure#
Imported data appears as a tree in the Stage panel. The structure depends on the file format. For example:
CGNS polyhedral datasets contain:
Multiple NGON_n blocks: These are surface meshes (faces of the 3D volume).
One NFACE_n block: This is the 3D volumetric mesh that references the surface faces.
A coordinates block: Point coordinates shared among the elements.
NumPy datasets contain:
A NumPyDataSet node with NumPyArrays underneath, one per array in the file.
The element type for each prim is displayed in the Properties panel.
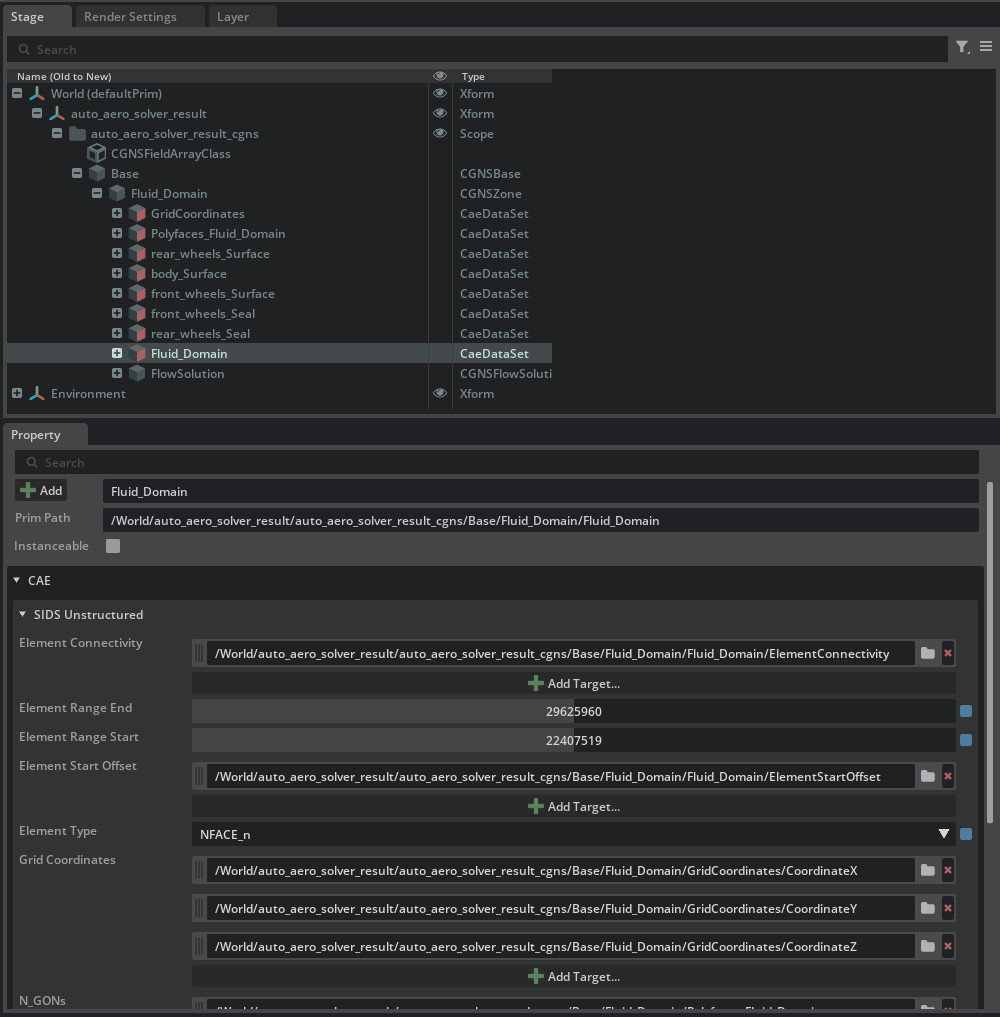
Properties Panel#
Select any prim that has a CAE API applied to view its properties. Below the standard path and transform sections, the CAE group displays all CAE-specific properties:
For dataset prims: data model properties, format-specific attributes
For field array prims: field-specific properties and format details (for example, CGNS field array properties for CGNS data)
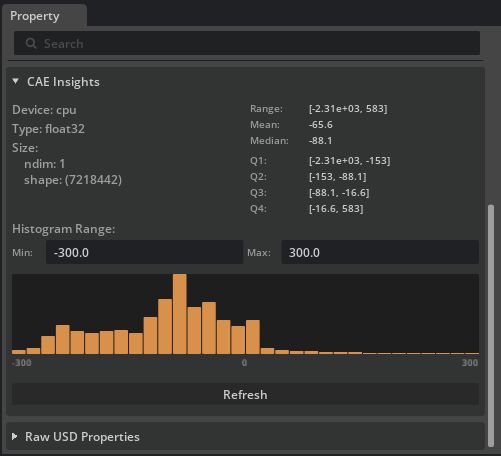
CAE Insights#
On any field array prim, the CAE Insights section under the CAE group shows metadata and statistics for the current time sample:
Device: Where the array data resides (CPU or GPU). Useful for verifying that data has been transferred to the GPU for accelerated processing.
Array type: The data type (for example,
float32,int64). Helps identify precision and whether 64-bit downconversion is active.Shape: Dimensions of the array (number of elements and components).
Ranges: Min and max values per component. For vector fields, each component is shown separately.
Quartiles: Q1, median, and Q3 distribution statistics (scalar fields only). Useful for understanding whether a field is uniformly distributed or skewed.
Histogram: A 32-bin value distribution chart (scalar fields only). Adjust the min/max fields to zoom into a specific range. Useful for choosing colormap boundaries.
Note
CAE Insights data is not refreshed automatically. Click Refresh to update the metadata. This is by design: for time-varying data with many time steps, automatic refresh would trigger unnecessary reads and slow performance. Quartiles and histograms are computed on the GPU for fast results even on large datasets.

Try It: Explore the Vehicle Dataset#
Continuing from the previous Try It where you imported auto_aero_solver_result.cgns:
In the Stage panel, expand
/World/auto_aero_solver_result_cgns/Base/Fluid Domain. You should see several element sections (body.Surface,front_wheels.Surface,rear_wheels.Surface,Fluid Domain), aGridCoordinatesblock, and aFlowSolutiongroup.Expand
FlowSolution. This group contains the cell-centered field variables:Pressure,Velocity_0,Velocity_1, andVelocity_2.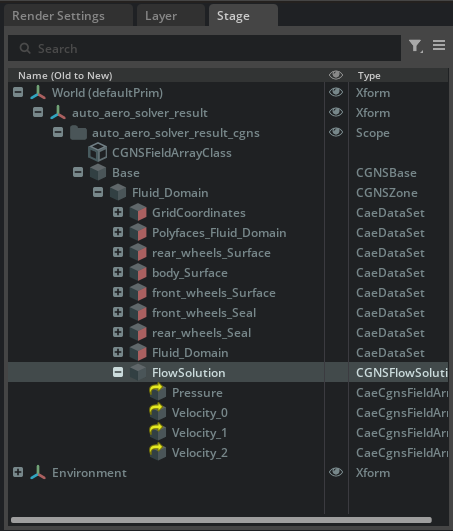
Select
Pressure. In the Property panel, observe the CAE group showing the field’s data type, shape, and format-specific properties.With
Pressureselected, scroll to the CAE Insights section and click Refresh. Note the array shape, value range, and histogram distribution.
Set the histogram Min to -300 and Max to 300, then click Refresh. The histogram zooms in to show the distribution within that range, making it easier to identify where most pressure values concentrate.