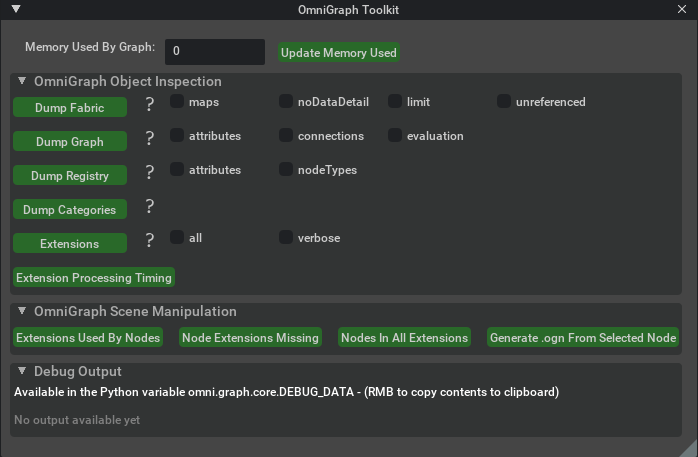
Toolkit#
The OmniGraph toolkit window provides a variety of inspection and debugging tools that are mostly of interest to low level developers and node writers. It is constantly evolving to provide the tools most relevant to developers, both internal and external.

Memory#
The top section shows information on memory usage. The memory use must be updated manually as it changes constantly. The values shows in this section are only a rough guide as not all memory is tracked internally. It is more useful as a tool to see changes in memory usage as a session proceeds, to flag potential memory leaks.
Inspection#
This section has functions that inspect internal data in OmniGraph, implemented via the omni.inspect extension.
Each of the functions has a “?” icon through which you can get details on what it outputs and what each of the
flags appearing beside it represent.
Dump Fabric |
Presents a JSON format view of the data OmniGraph uses to link to the underlying Fabric data used for computation |
Dump Graph |
Presents a JSON format view of the data known to the currently existing OmniGraphs |
Dump Registry |
Presents a JSON format dictionary of all registered node types. It’s worth noting here that nodes that are implemented in Python will be in a sub-list labeled PythonNode. |
Dump Categories |
Presents a JSON format list of all of the currently known node type categories |
Extensions |
Extracts information regarding the known extensions downstream of |
Extension Processing Timing |
Displays the timing information gathered when OmniGraph notices that a new extension has been enabled and it processes the extension to find and register any existing OmniGraph nodes and tests. |
Scene Manipulation#
This section contains a number of features that show and manipulate high level contents of the current stage.
Extensions Used By Nodes |
List the current node types in use, grouped by the extension in which they were defined |
Node Extensions Missing |
List a guess at extensions not currently enabled, but which define existing nodes. Until the extensions are enabled such nodes will not operate correctly |
Nodes In All Extensions |
List every node type known to OmniGraph, grouped by the extension in which they were defined |
Generate .ogn From Selected Node |
Take the attributes defined on the currently selected node and create a basic .ogn file that describes it. This can be used for a raw Prim with properties defined through USD as well as an existing OmniGraph node with extra attributes added dynamically. |
Debug output#
For most Inspection operations and some Scene Manipulation operations an output will be produced. This output will be shown in this section, as well as being copied into the global Python variable omni.graph.core.DEBUG_DATA. The section also provides a copy feature when the right mouse button is pressed, so that you can paste the data into an external editor.
Here is how you might process the JSON data that the Dump Graph button provides as output:
import json
import omni.graph.core as og
graph_data = json.loads(og.DEBUG_DATA)
for graph_path, graph_info in graph_data.items():
    print(f"Showing graph information at {graph_path}")
    print(f"   Evaluator Type = {graph_info['Evaluator']}")
    print(f"   Node Count = {len(graph_info['Nodes'])}")