Visual Scripting Menus#
Window -> Visual Scripting#
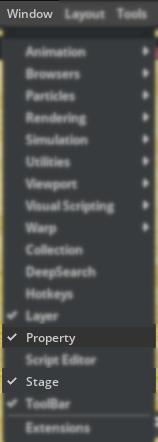
OmniGraph functionality appears in a few of the main menus. The first one is in the Window menu, and it lists the available UI panels and windows that can be opened for interacting with OmniGraph.
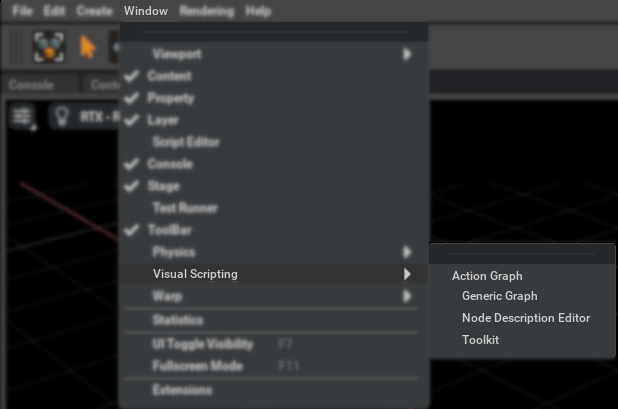
Both the Action Graph and Generic Graph entries will open up one of the Visual Graph Editors window in which you can create and modify an OmniGraph.
The Toolkit entry opens a window containing a debugging interface for users that want to peek into some of the internals of OmniGraph. Inside the Toolkit you will find entries that allow you to inspect various facets of the OmniGraph data. The contents of the window evolve as new features are introduced.
Create -> Visual Scripting#
In order to support a more consistent experience when creating new objects OmniGraph has added an entry into the Create menu that enables creation of simple OmniGraph types.
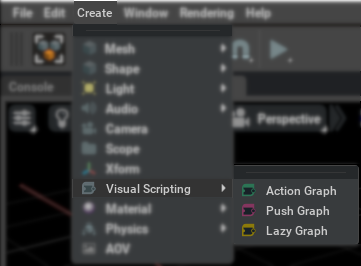
Through this menu you can create new instances of the three main types of OmniGraph - Action Graph, Push Graph, and Lazy Graph. The difference between them lies only in their primary method of evaluation. An Action Graph will evaluate when triggered by an event. A Push Graph will evaluate every time the application updates, or “ticks”. A Lazy Graph will evaluate only the subsection of a graph that has changed since the last evaluation.
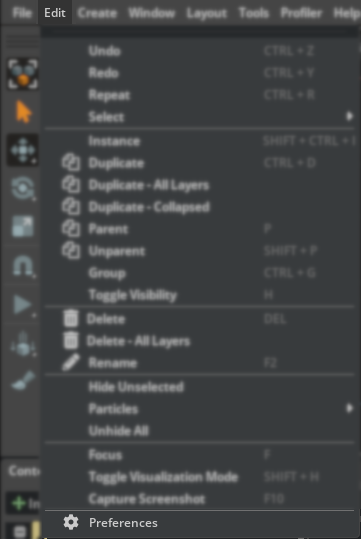
Edit -> Preferences#
Like many other subsystems, OmniGraph has a set of user-configurable settings. They can be found in the Visual Scripting panel of the Preferences window.
|
|
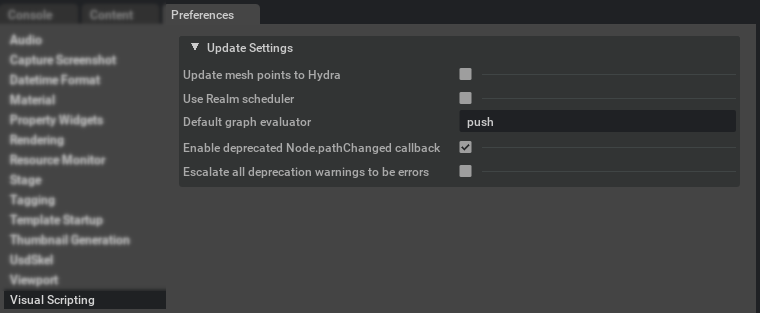
The settings available in that panel are described in the Settings Editor.
Window -> Property and Window -> Stage#
These two menu entries, though normally applied to USD stages and prims, have specialized features added to support OmniGraph.
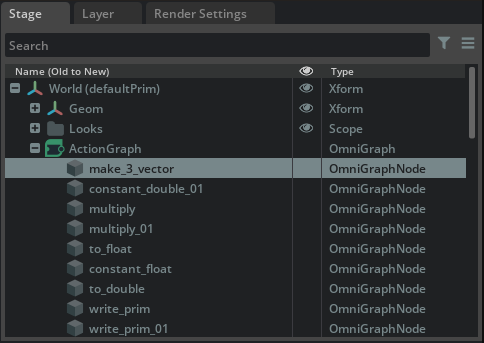
In the stage window you can see the special icon that indicates an OmniGraph prim definition. Different colors indicate different graph types - green for Action Graph, pink for Push Graph, and yellow for Lazy Graph. The prim types are OmniGraph for the main graph prim, and OmniGraphNode for the prims below it that correspond to nodes in the graph.
In the property panel the prim properties are divided into three sections when OmniGraph nodes are present. The top section “OmniGraph Node” represents the OmniGraph-specific interface to the attribute values, explained in Property Panel. The middle section “Compute Graph” is an OmniGraph-centric representation of the attributes on the node. The lower section “Raw USD Properties” presents the prim’s property values as USD sees them.
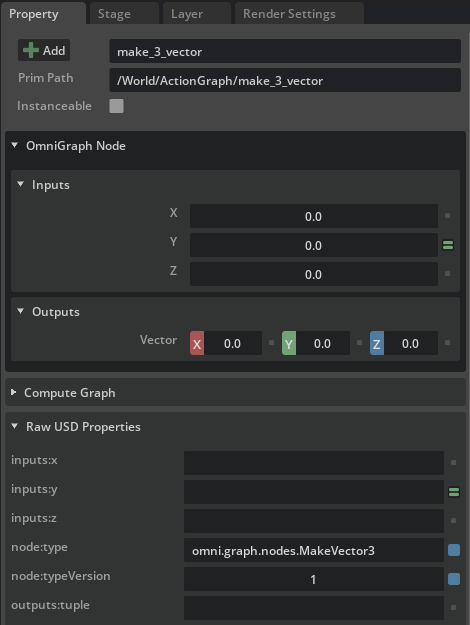
In many cases the contents of the bottom two sections will be very similar but occasionally a node will not store some of its data in USD, only storing it as temporary data in Fabric.