RTX Radar Action Graph Overview
If your not sure what OmniGraph is, or you need a refresher, the OmniGraph extension documentation is a good place to start, and the OmniGraph tutorial is also helpful.
For this overview, we are going to go over the Omniverse OmniGraph Action Graph created when running the standalone example:
./python.sh standalone_examples/api/omni.isaac.debug_draw/rtx_radar.py
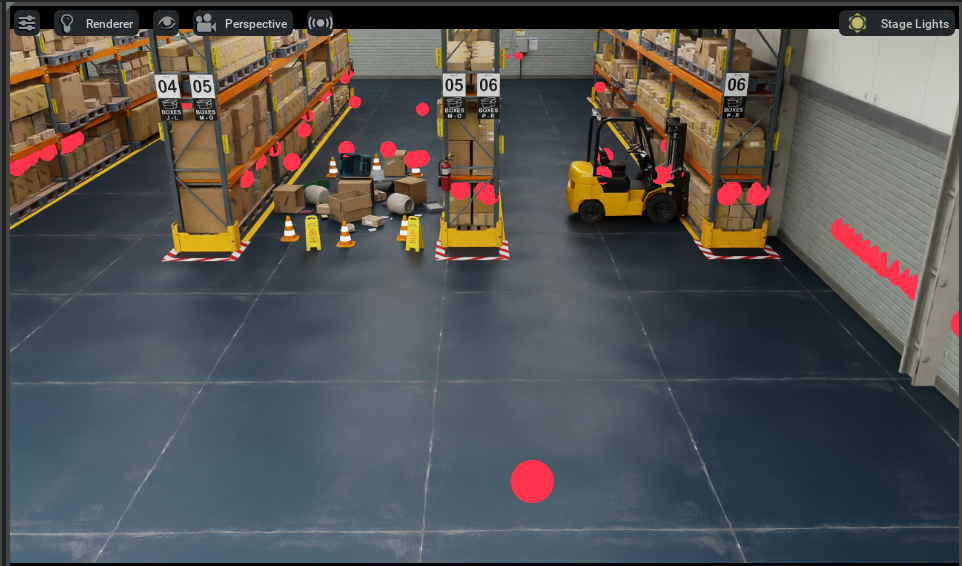
Once the example is finished loading, you should see an RTX Radar sensor spinning in a warehouse.

To explore the graph, go to Window > Visual Scripting > Action Graph,
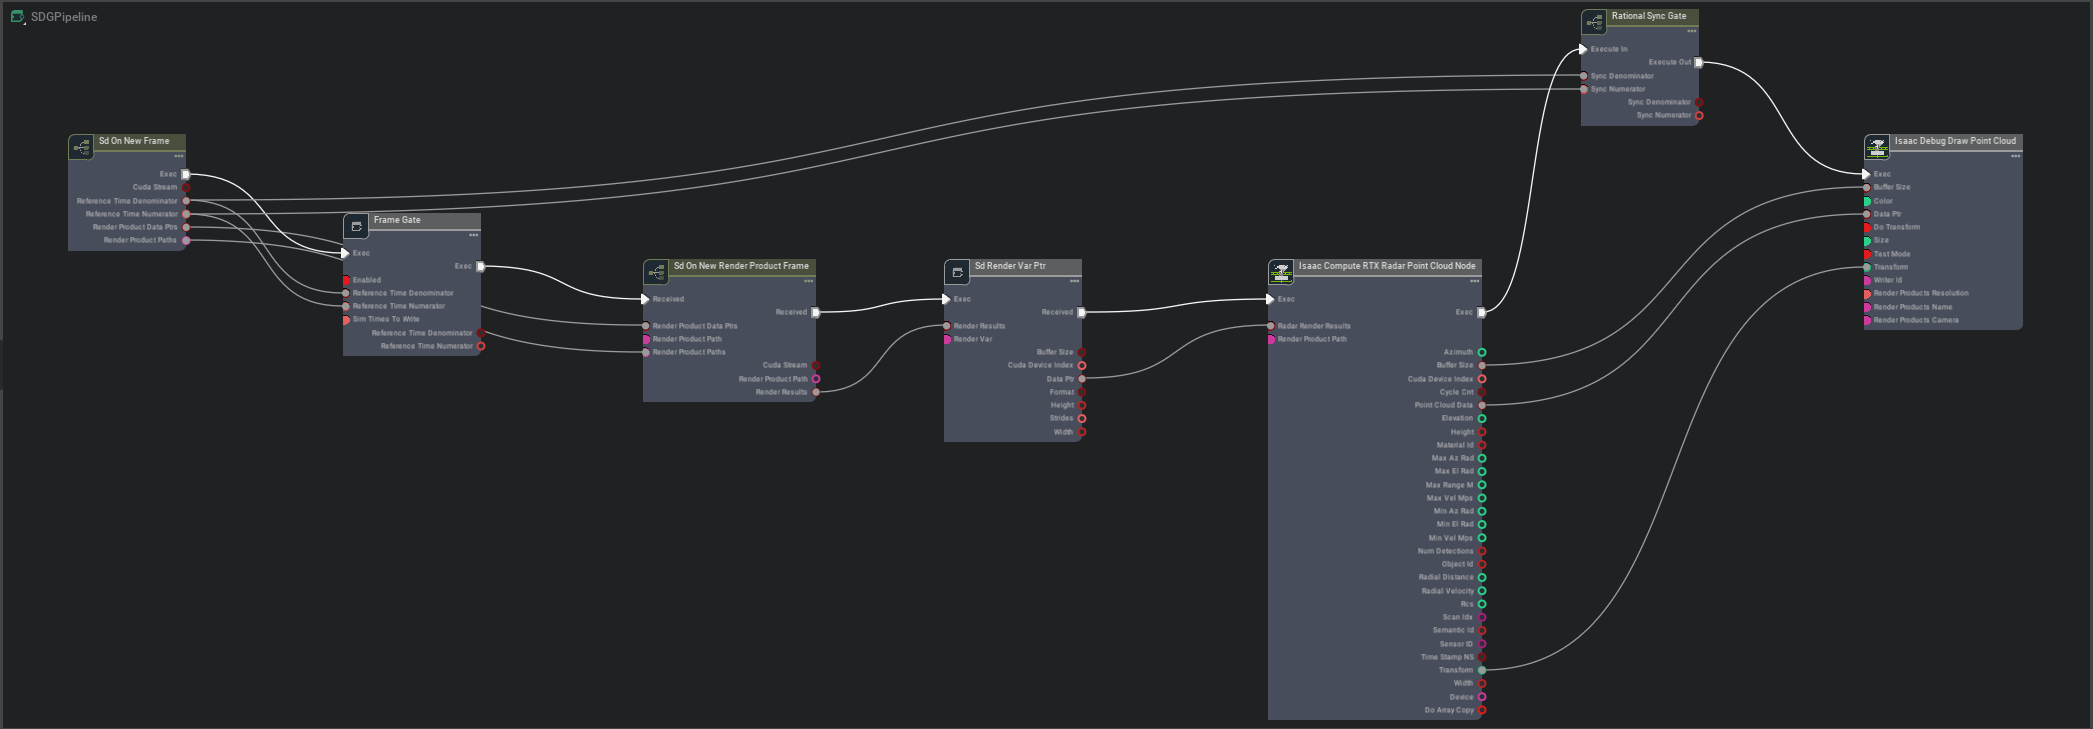
choose Edit Action Graph and open the graph named /Render/PostProcess/SDGPipeline it created.

The first important node to notice is Isaac RenderVar To CPU Pointer Node. It is set up to pull the RtxSensorCpu buffer from the frame’s render product. RtxSensorCpu is the raw result from the RTX Sensor Rendering Pipeline, and what it contains depends on what type of sensor is created.

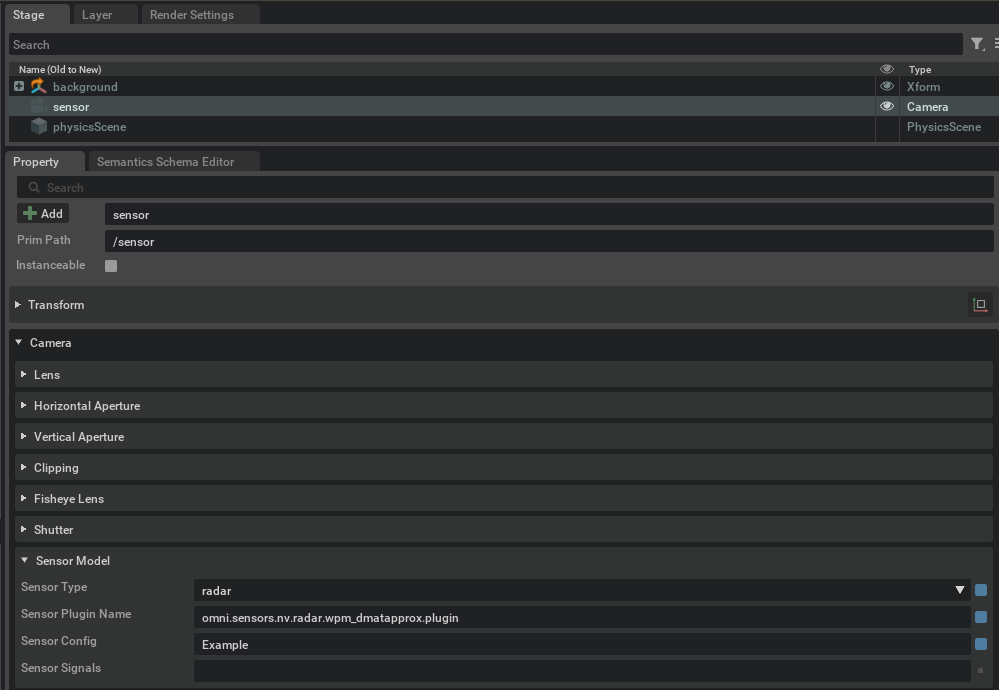
If you select the sensor in the stage, you will notice in the property window that Sensor Plugin Name is omni.drivesim.sensors.nv.radar.radar_core.plugin,
which is the name of the plugin that renders radar data into the RtxSensorCpu buffer.
The CPU Pointer output by Isaac RenderVar To CPU Pointer Node is used by the RTX Radar nodes that can create point clouds, flat scans, or even raw data from the RtxSensorCpu buffer. In this example, it hooks up to a Compute RTX Radar Point Cloud Node, but it could just as easily be hooked up to any number of RTX Radar based nodes of type Print RTX Radar Print Info Node.
The output from the Compute RTX Radar Point Cloud Node is generally sent to a writer or publisher node of some kind, like ROS, or ROS2, but in this network it is output to an Isaac Debug Draw Point Cloud Node, which is why you can see it rendered in the viewport.