USD Debug Logging
OpenUSD ships with a debug logging feature that prints to STDOUT. One can configure it using the TF_DEBUG environment variable or the TfDebug interface. All of the debug message types are available using the TfDebug::GetDebugSymbolDescriptions() method.
Here are some useful examples that are present in the USD 22.11 release:
AR_RESOLVER_INIT         : Print debug output during asset resolver initialization
PLUG_LOAD                : Plugin loading
PLUG_REGISTRATION        : Plugin registration
USD_CHANGES              : USD change processing
USD_STAGE_LIFETIMES      : USD stage ctor/dtor messages
Combine multiple symbols and wildcards to enable multiple symbol messages:
TF_DEBUG=*               : Enable all debug symbols
TF_DEBUG=PLUG_* AR_*     : Enable debug symbols for all ``PLUG_*`` and ``AR_*`` messages
Accessing Nucleus Checkpoints
The samples demonstrate how to create Nucleus checkpoints. For information about opening checkpointed files at different versions, see the Nucleus Version Control Documentation.
Configuring GCC
When building on Linux this project requires “make” and “g++”.
To obtain “make” type
`sudo apt install make`(Ubuntu/Debian), or`yum install make`(CentOS/RHEL).For “g++” type
`sudo apt install g++`(Ubuntu/Debian), or`yum install gcc-c++`(CentOS/RHEL).
Configuring MSVC
When repo.bat build is executed on Windows a version of the Microsoft Visual Studio Compiler and the Windows 10/11 SDK are downloaded and referenced by the generated Visual Studio projects. If a user wants the projects to use an installed version of Visual Studio then simply run repo.bat build --use-devenv. This will use vswhere.exe to discover where Visual Studio is installed and will build using devenv rather than MSBuild.
Visual Studio Visualizer for USD
The OpenUSD package included with the samples includes a Visual Studio Debugger Visualizer file that shows reasonable values in the debugger for the USD data types. This only works with the debug version of the USD libraries, but it can be immensely useful when debugging to quickly visualize prims, stages, attributes, and other USD objects. Because the USD API is namespaced, every different major or minor version requires different visualizers. This section will walk through the process of updating the USD.natvis file that comes in the USD package, installing it onto a development system, and using the visualizer in the Visual Studio debugger.
Updating USD.natvis to the correct versioned namespace
Find USD.natvis in the /_build/target-deps/usd/debug/visualizers folder after building the samples. Open it in a text editor and update every instance of pxrInternal_v0_20__pxrReserved__ with the appropriate major_minor version you are using. For instance, when this documentation was written, the distributed version of USD was 0.22.11, so it should be updated with pxrInternal_v0_22__pxrReserved__.
Installing the visualizer
Run the install-visualizers.bat script in the same folder as above. This will install the visualizer into your Visual Studio user folder, which is likely under the %USERPROFILE%\Documents\Visual Studio 2022\Visualizers folder. Note that if you want to work with multiple USD versions at the same time you should possibly rename these visualizers something like USD_22.natvis or something like that.
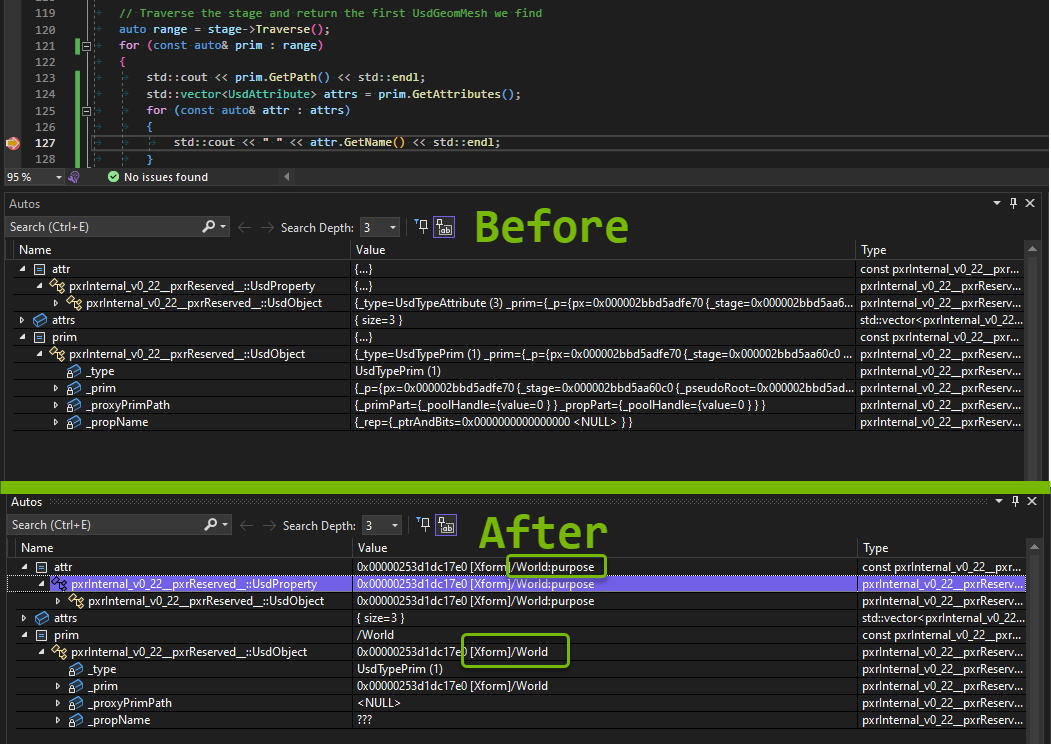
Using the visualizer in Visual Studio
Immediately after installing the visualizer it is available when debugging a program that uses the DEBUG USD libraries. When stepping through code, hover over a variable or look at the Auto, Locals, or Watch Debug windows and see that the the UsdPrim object shows its type and path.