Observability#
The USD Search API Helm chart includes monitoring functionality that sets up metrics collection and pre-configured dashboards for tracking background indexing progress and the overall system state. This requires the Prometheus Operator and Grafana with dashboard provisioning. You can use the Kube Prometheus Stack to meet these requirements.
To enable monitoring, provide the following command line arguments during the Helm chart installation:
--set deployGrafanaDashboards=true \

--set deployServiceMonitors=true
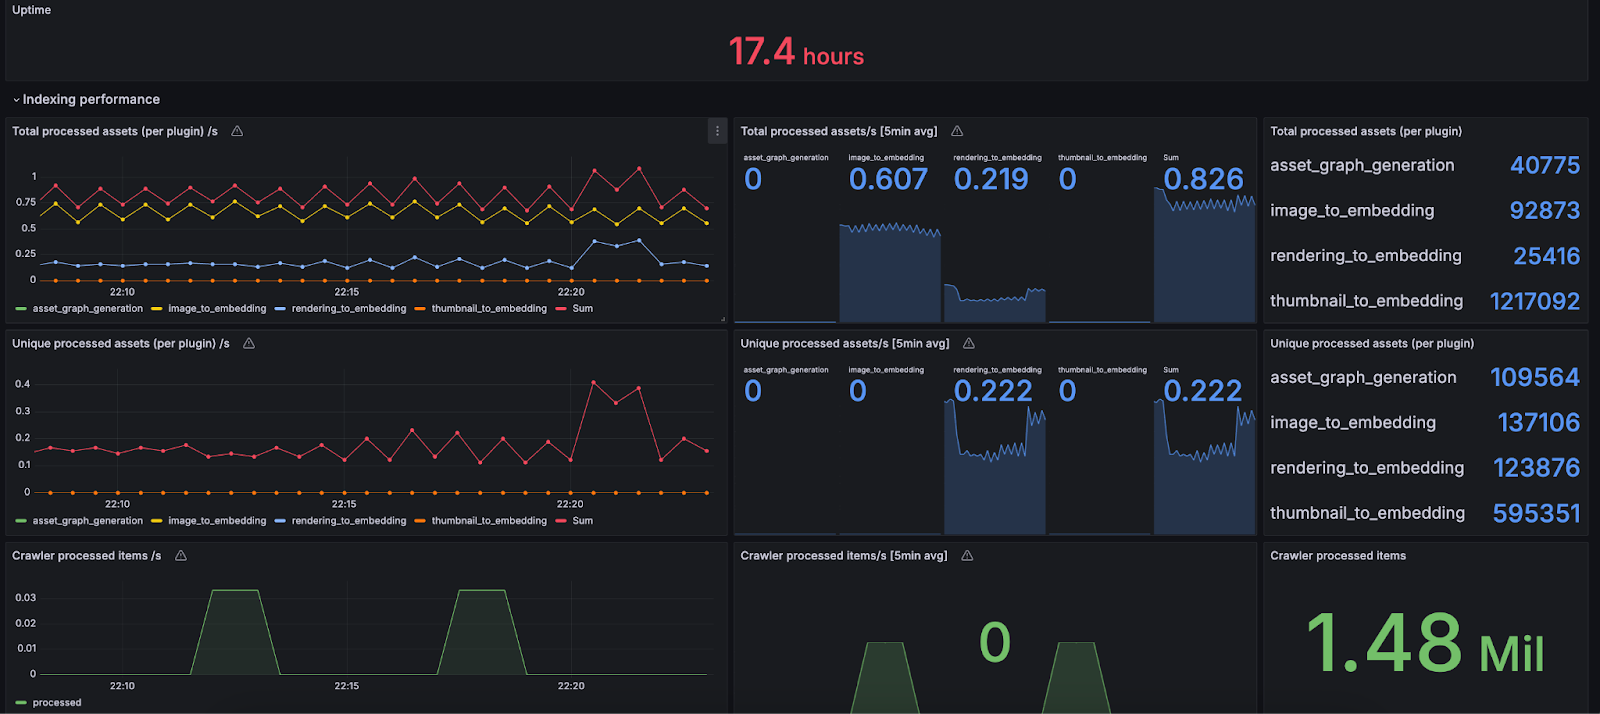
With the above flags enabled, the metrics will be automatically scraped by the Prometheus service (part of the Prometheus stack) and visualized in Grafana as DeepSearch / DeepSearch (1.0.0) and DeepSearch / NGSearch dashboards.
A sample visualization of the dashboard is provided below: