Portal Sample Metrics#

Overview#
The Omniverse DGX Cloud Portal (Version 1.2.0 and later) includes built-in OpenTelemetry (OTel) metrics export for session monitoring and observability. This page describes the metrics the Portal exports, the attributes on each metric, and how to configure export to an OTel collector and backends such as Azure Monitor or Grafana.
Metrics Exported#
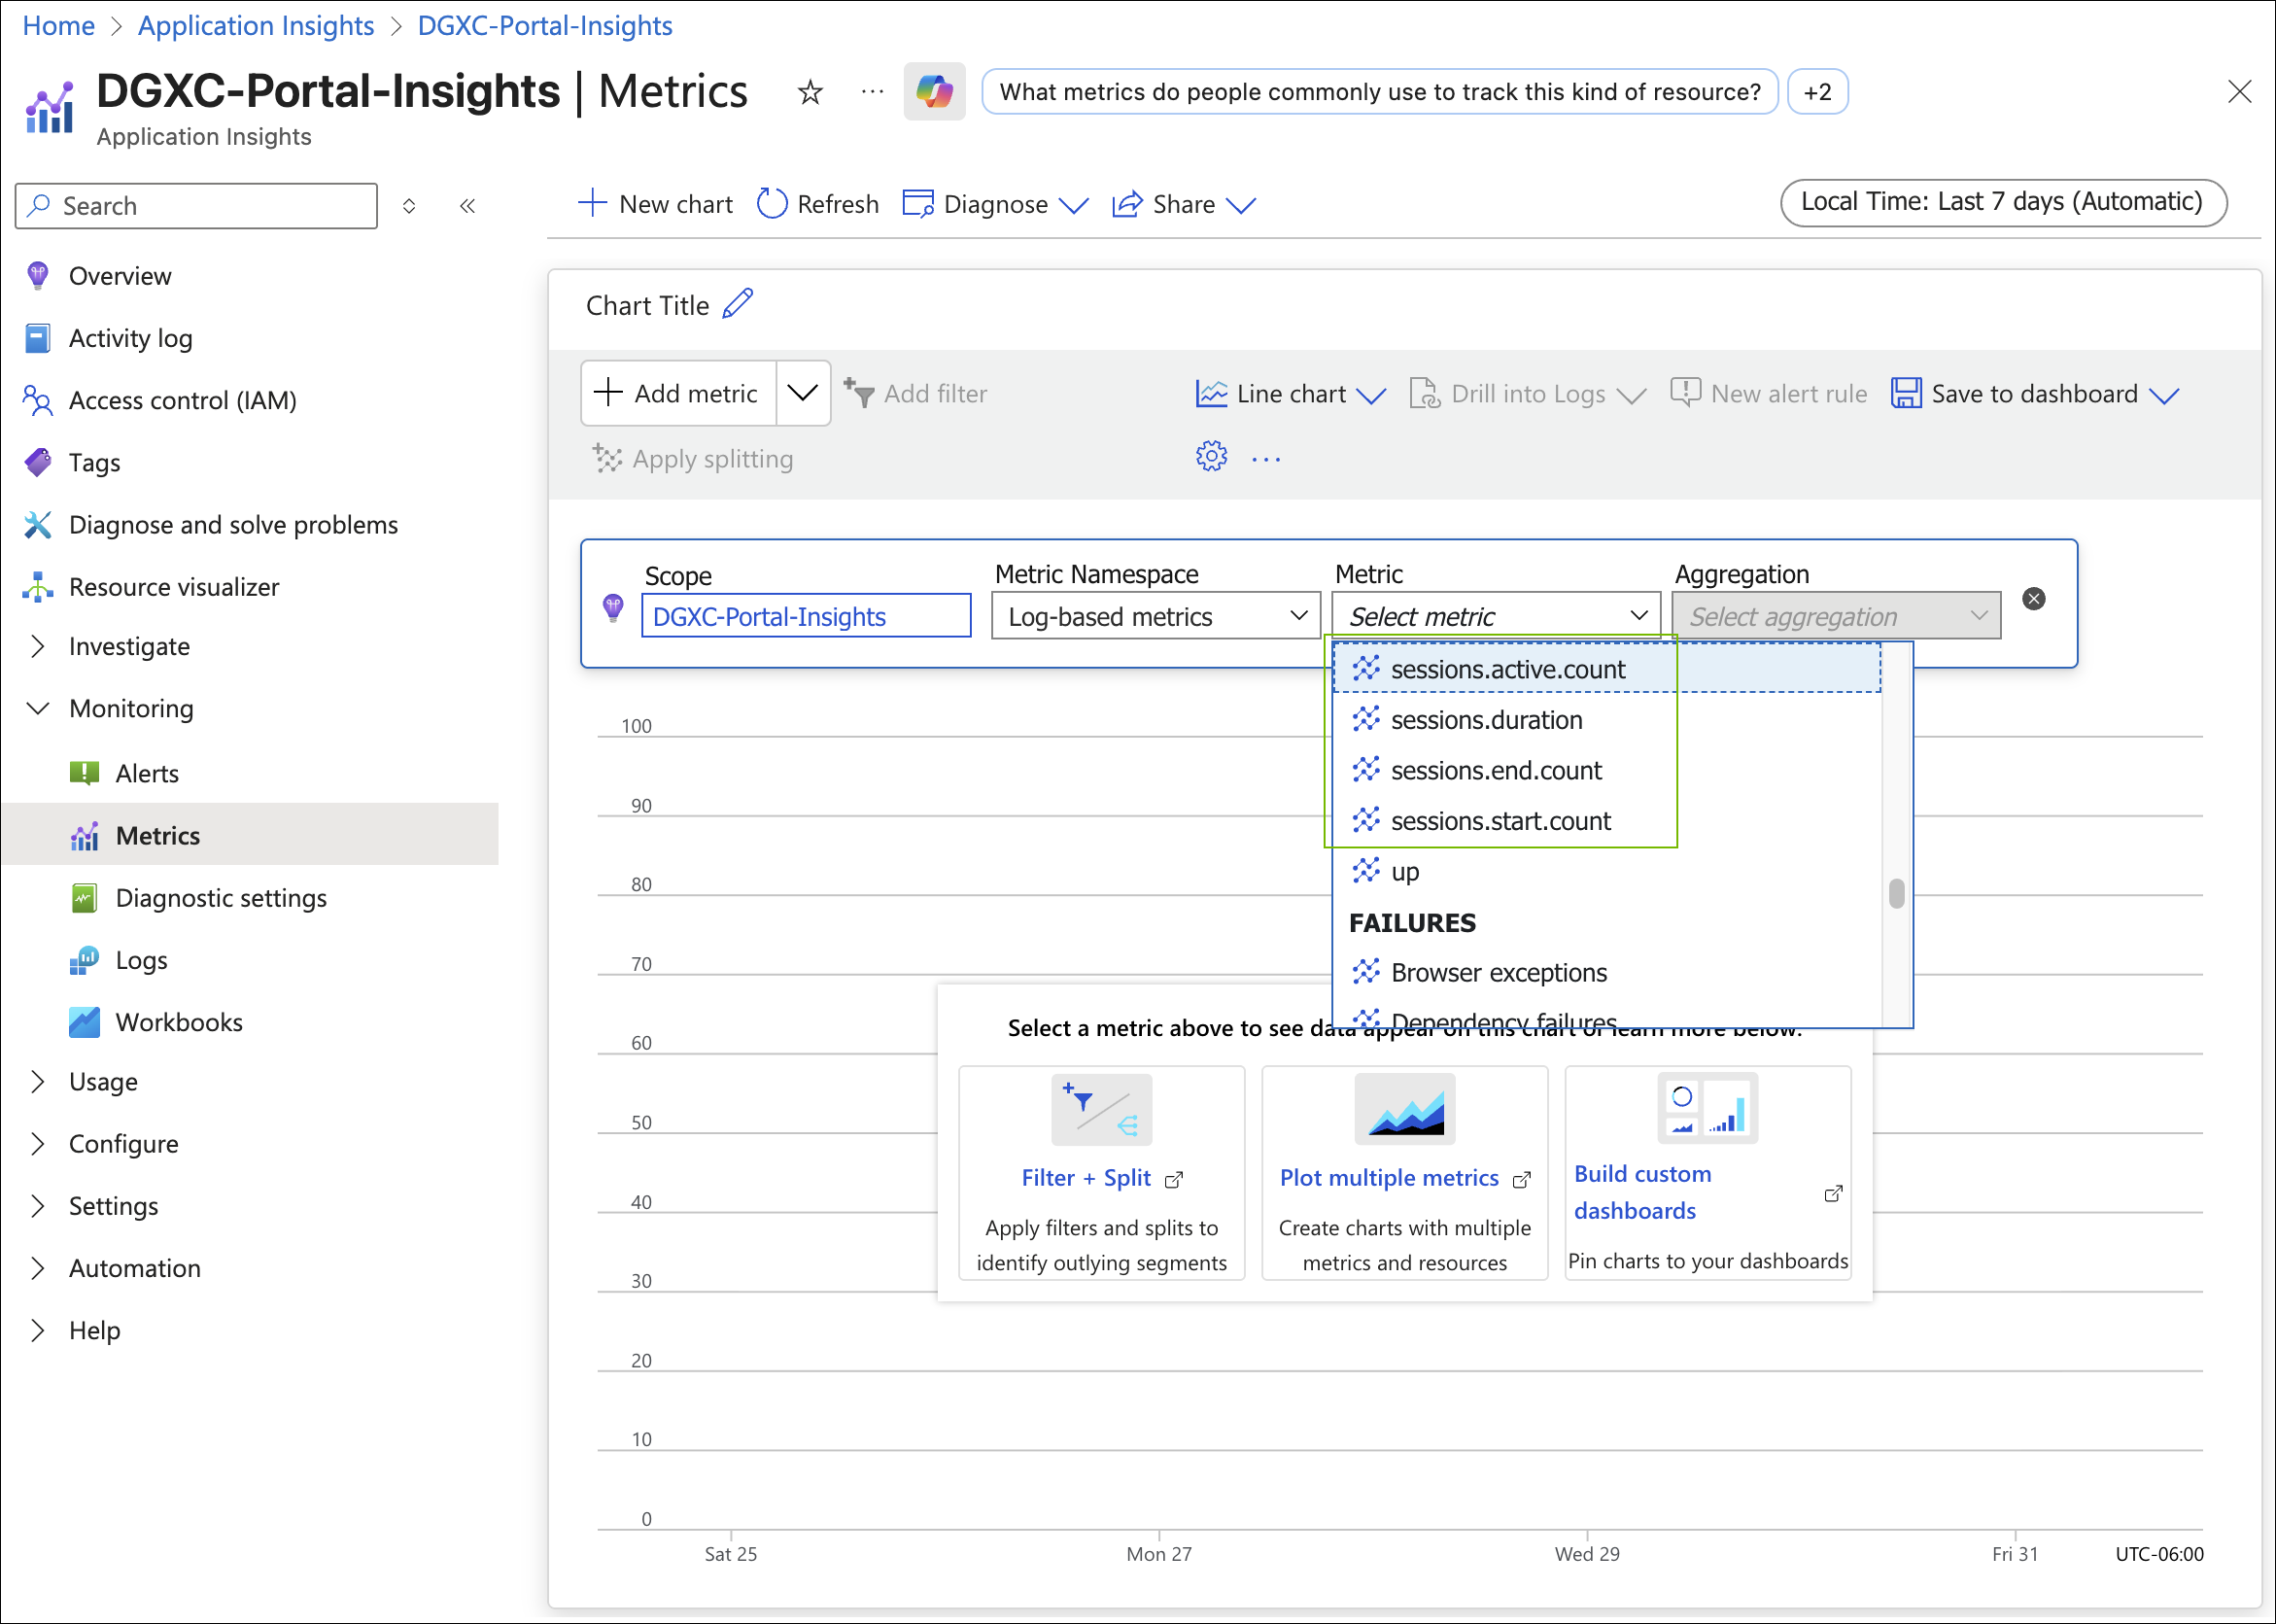
The Portal exports the following metrics:
Metric |
Description |
|---|---|
sessions.active.count |
Current number of active streaming sessions |
sessions.start.count |
Total number of sessions started |
sessions.end.count |
Completion rate analysis and session lifecycle tracking; includes |
sessions.duration |
Session duration in seconds with histogram buckets |
Dimensional Data#
Each Portal Sample metric includes the following attributes for filtering and analysis:
Attribute |
Description |
|---|---|
session.id |
Unique session identifier |
session.username |
Name of the user who initiated the session |
session.user |
User ID |
session.app |
Name of the Kit App streamed |
nvcf.function_id |
NVIDIA Cloud Function ID |
nvcf.function_version_id |
NVIDIA Cloud Function Version |
session.duration.seconds |
Session duration |
session.status |
How the session ended (for example, user-initiated termination or timeout); powers the Session Ending Reason pie chart in the sample dashboards |
Prerequisites#
Portal deployment deployed as a container within a Kubernetes cluster or a standalone instance
An OTel collector instance available for your deployment. TCP Ports 4317 (gRPC) and 4318 (HTTP) must be open and accessible on the collector instance
Network connectivity between the Portal Sample and the collector instance
An observability platform such as Azure Monitor, Datadog, or Grafana Cloud
Azure Monitor Setup#
Use an existing Azure Monitor/Application Insights instance, or create a new one. After creation, open the resource Overview > JSON View and copy the ConnectionString value. It should resemble the following:
InstrumentationKey=xxxxxxxxxx;IngestionEndpoint=https://xxxxx.applicationinsights.azure.com/;LiveEndpoint=https://xxxxx.monitor.azure.com/;ApplicationId=xxxxxxx
Create the OTel Collector#
Launch the collector as a Docker container so it can receive metrics from the Portal Sample and forward them to Azure Monitor:
docker run -d \
        --name otel-collector \
        -p 4317:4317 \
        -p 4318:4318 \
        -e APPLICATIONINSIGHTS_CONNECTION_STRING="InstrumentationKey=xxxxxxxx-xxxx-xxxx-xxxx-xxxxxxxxx;IngestionEndpoint=https://xxxx.in.applicationinsights.azure.com/;LiveEndpoint=https://xxxxxx.livediagnostics.monitor.azure.com/;ApplicationId=xxxxxx-xxxxx-xxxxx-xxxxx-xxxxxxxxxxxx" \
        -v "$(pwd)/otel-collector-config.yaml:/etc/otelcol-contrib/config.yaml" \
        otel/opentelemetry-collector-contrib:latest
Export Environment Variables#
Configure the portal to send built-in OTel metrics to your collector by setting these environment variables on the Portal Sample instance:
export OTEL_EXPORTER_OTLP_ENDPOINT="http://<IP_OF_OTEL_INSTANCE>:4317"
export OTEL_SERVICE_NAME="web-streaming-backend"
Note
The OTEL exporter endpoint must be an IP address or a fully qualified DNS name.
Metrics Export Verification#
Check collector logs:
docker logs -f otel-collector
Test Metrics Export (Portal Sample)#
On the Portal Sample instance run the test script (example):
cd ov-dgxc-portal-sample/backend
poetry run test-metrics
Expected output:
Testing OpenTelemetry metrics...
Recording session start...
Incrementing active sessions...
Recording session end...
Decrementing active sessions...
Metrics recorded. Check your collector/backend for the data.
Waiting 10 seconds to ensure export...
To generate session activity from the Portal Sample, start a streaming session.
Confirm Telemetry on Azure Monitor#
In the Azure Portal, browse to Application Insights for the resource receiving telemetry. Open Monitoring > Metrics and verify that custom metrics appear in the metrics dropdown.
Sample Azure Monitor Queries#
Active Sessions Monitoring:
customMetrics
| where name == "sessions.active.count"
| extend session_app = tostring(customDimensions.session_app)
| extend session_user = tostring(customDimensions.session_user)
| extend nvcf_function_id = tostring(customDimensions.nvcf_function_id)
| project timestamp, name, value, session_app, session_user, nvcf_function_id
Active Session Duration:
customMetrics
| where name == "sessions.duration"
| extend session_app = tostring(customDimensions.session_app)
| extend session_user = tostring(customDimensions.session_user)
| extend nvcf_function_id = tostring(customDimensions.nvcf_function_id)
| project timestamp, name, value, session_app, session_user, nvcf_function_id
Usage Trends Over Time:
customMetrics
| where name == "sessions.start.count"
| extend session_app = tostring(customDimensions.session_app)
| summarize session_starts = count() by bin(timestamp, 1h), session_app
| render timechart
Session Ending Reasons (Pie Chart):
             customMetrics
             | where name == "sessions.end.count"
             | extend reason = tostring(customDimensions["session.status"])
             | summarize SessionEnds = sum(value) by reason
The Azure Portal Metrics Workbook includes a Session Ending Reason pie chart that uses this query pattern. For import steps, refer to Sample Dashboards.
Installing Grafana Dashboards#
Prerequisites#
Before importing the Grafana dashboards, ensure you have the following prerequisites in place:
A configured Grafana data source that exposes the required metrics.
Steps#
To install the Grafana dashboards for Omniverse DGX Cloud Portal metrics, follow these steps:
Download the
portal-metrics.jsonfile from the Omniverse DGX Cloud Portal Sample GitHub repository or your local copy.Log in to your self-managed Grafana instance or Grafana Cloud.
Verify metrics availability by following these steps: - Click on the Drilldown tab in the left navigation pane and then select Metrics to confirm the needed metrics are present.
After you have confirmed metrics are available in Grafana, proceed to import the dashboard. The menu path is Dashboards > + > Import > Import a Dashboard.
Click Dashboards in the left navigation pane.
Click the + icon in the upper-right corner.
Select Import.
Choose Import a Dashboard.
Drag and drop the
portal-metrics.jsonfile into Upload dashboard JSON file.Click Load in Find and import dashboard for common applications and select
portal-metrics.json.Copy and paste the contents of
portal-metrics.jsoninto Import via dashboard JSON model.Click Load to upload the dashboard.
Edit the imported dashboard as needed to customize panels, data sources, or variables.
Save the dashboard. You can now view the dashboard with your desired metrics.
Notes#
If your imported dashboard references a data source name that differs from your environment, update the dashboard’s data source mapping during import or edit the dashboard after import.
Keep a copy of each JSON file (for example
portal-metrics.json) in your repo so you can re-import or version dashboards as needed.
Next Steps#
You can export Portal Sample metrics through an OTel collector to Azure Monitor or Grafana and validate them with the procedures on this page. For prebuilt dashboards and workbook import steps, refer to Sample Dashboards.