Azure Monitor Setup#
Overview#
The sections below describe how to configure Azure Monitor as a telemetry endpoint for Omniverse on DGX Cloud.
Add Telemetry Endpoint#
Note
If you would like to use an existing Application Insights and Log Analytics Workspace, navigate to Overview, then JSON View to capture the connection string.
Azure Monitor Setup
To add Azure Monitor as a telemetry endpoint, you first need to create an Application Insights instance within your Azure account by following the steps below:
Create a new Application Insights Instance.
Log into Microsoft Azure. Click Monitor, then Application Insights.
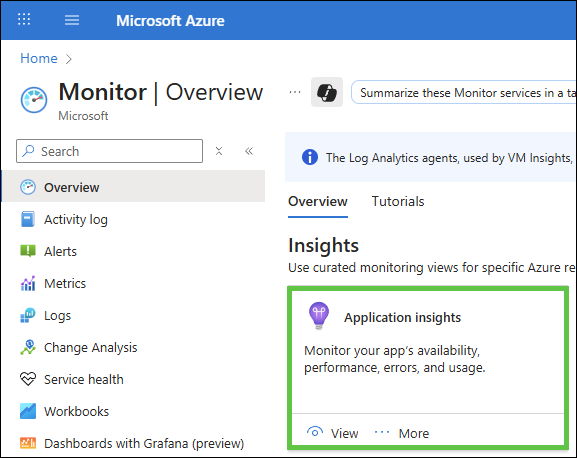
Under Application Insights, click View, and then +Create.
Choose the appropriate values for Subscription, Resource Group, and Log Analytics Workspace as defined in your tenant.
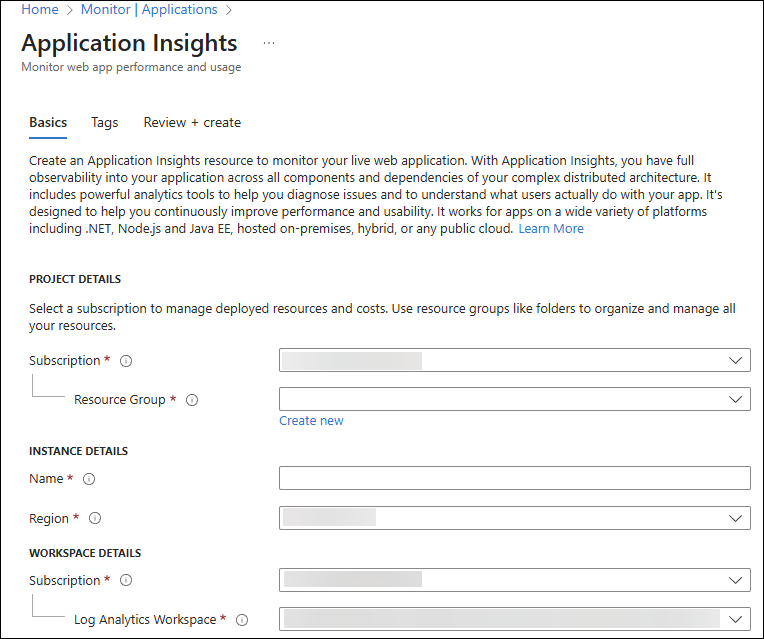
Click Review + create.
Navigate to
Overview, thenJSON Viewand then capture theConnectionString Value
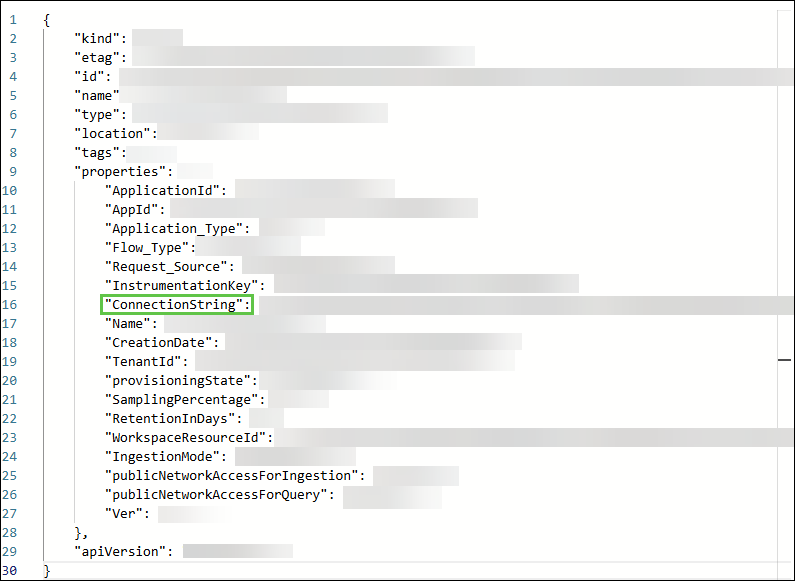
Once you have the connection string, you can then verify the telemetry is being sent to Azure Monitor.
Verify Telemetry Appears within Azure Monitor#
To verify that telemetry is being sent to Azure Monitor, navigate to your Application Insights instance within the Azure portal.
Sample KQL queries:
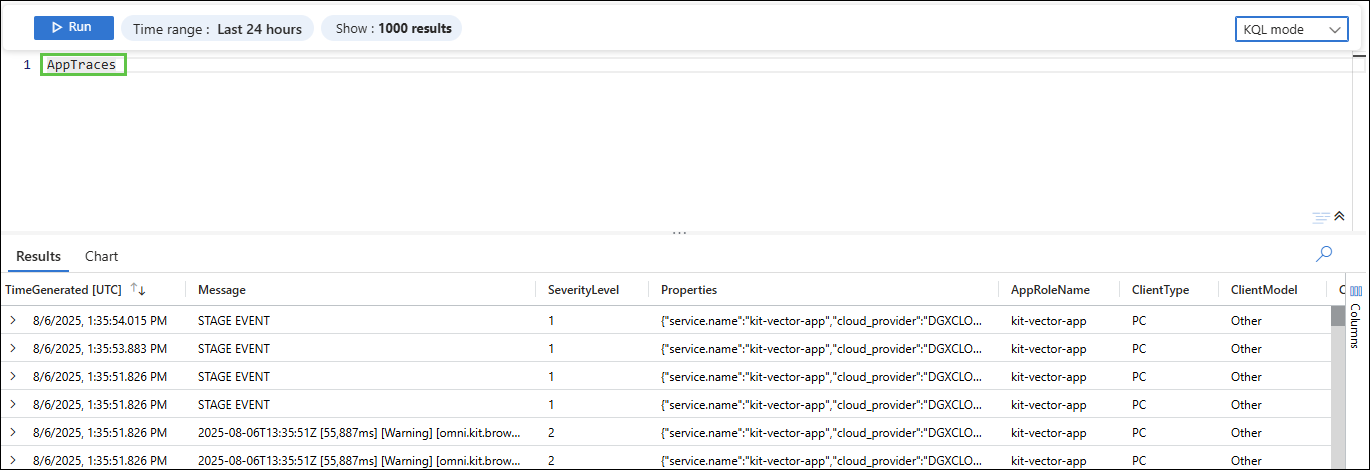
For Logs:
AppTraces
| where Properties.function_id == "xxxxxxxxxxxx"
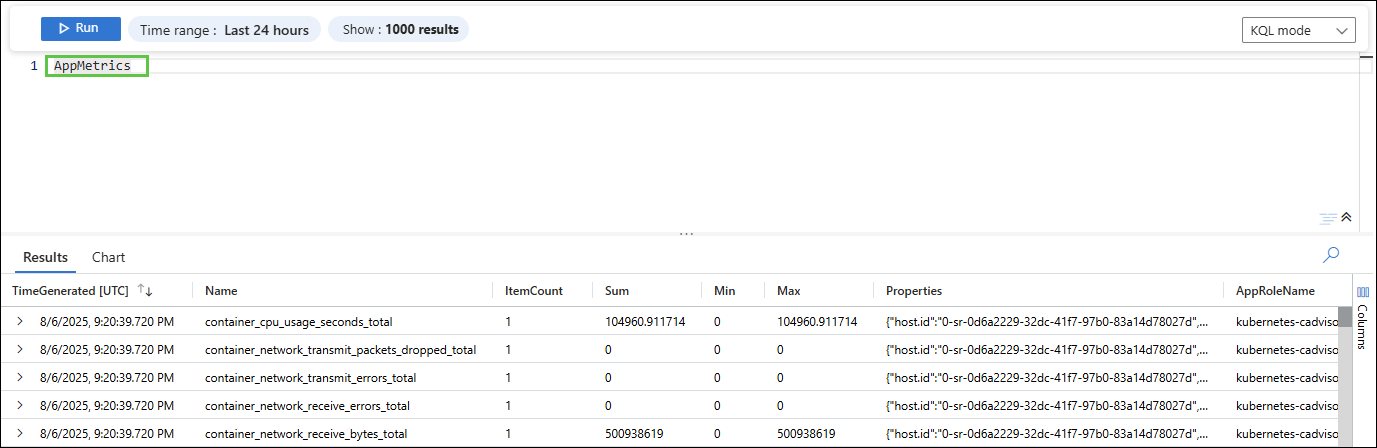
For Metrics:
AppMetrics
| where Properties.function_id == "xxxxxxxxxxxx"
OpenTelemetry (OTel) Collector Configuration For Azure Monitor#
The OTel collector can be hosted on the same instance as the portal or on a separate host by configuring the collector to receive metrics from the portal, processing them (add labels, batch), and then forward these metrics to Azure Monitor.
Create a directory for organizing the OTel collector configuration:
mkdir observability
Create the OTel collector config file:
touch otel-collector-config.yaml
Copy the following configuration into
otel-collector-config.yaml:
receivers:
        otlp:
                protocols:
                        grpc:
                                endpoint: 0.0.0.0:4317
                        http:
                                endpoint: 0.0.0.0:4318

processors:
        # Add resource attributes to identify the source
        resource:
                attributes:
                        - key: service.name
                                value: "ov-dgxc-portal"
                                action: upsert
                        - key: service.version
                                value: "1.0.0"
                                action: upsert
                        - key: deployment.environment
                                value: "production"
                                action: upsert

        # Batch processor for efficient export
        batch:
                timeout: 1s
                send_batch_size: 1024
                send_batch_max_size: 2048

        # Memory limiter to prevent OOM
        memory_limiter:
                limit_mib: 256
                check_interval: 1s

exporters:
        debug:
                verbosity: detailed
        azuremonitor:
                instrumentation_key: "${APPLICATIONINSIGHTS_CONNECTION_STRING}"

service:
        pipelines:
                metrics:
                        receivers: [otlp]
                        processors: [memory_limiter, resource, batch]
                        exporters: [debug, azuremonitor]
The azuremonitor exporter above uses the Application Insights ConnectionString as an environment variable. For additional information see: https://opentelemetry.io/docs/collector/.
NVCF Create Telemetry Endpoint#
You may also create the Telemetry Endpoint using either the NVIDIA Cloud Function (NVCF) UI or CLI.
Additional documentation for creating a Telemetry Endpoint can be found in the NVCF Telemetry Endpoint documentation.
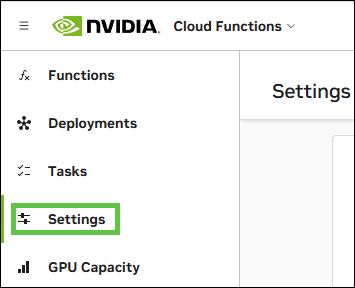
Using NGC, navigate to Cloud Functions, and then click Settings.
Under Telemetry Endpoints, click + Add Endpoint.

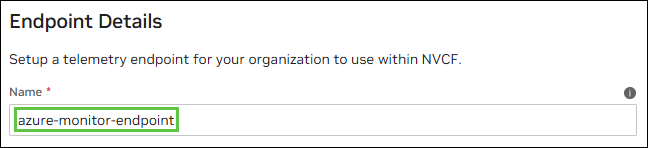
Provide an appropriate
NameunderEndpoint Details. (The example below usesazure-monitor-endpoint.)
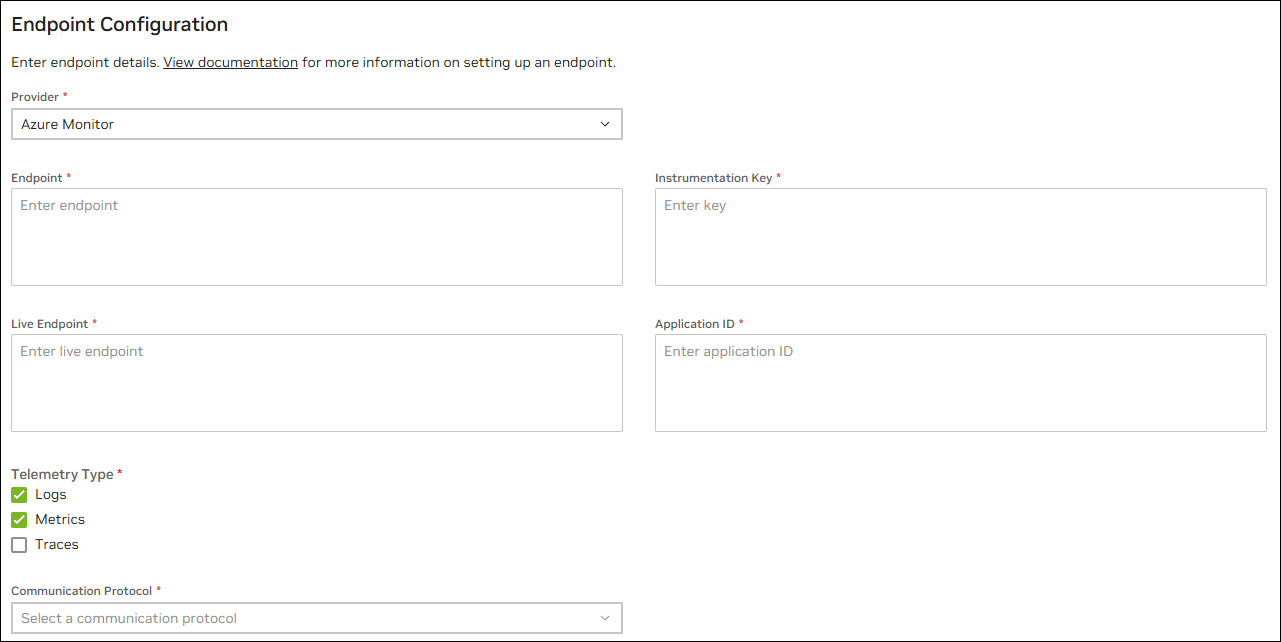
Click Azure Monitor.
From the copied connection string value from Azure, paste the following values:
Endpoint (IngestionEndpoint) |
|
Instrumentation Key |
xxxxxxxx-xxxx-xxxx-xxxx-xxxxxxxxxxxx |
Live Endpoint |
|
Application ID |
xxxxxxxx-xxxx-xxxx-xxxx-xxxxxxxxxxxx |
Click Logs, then Metrics under Telemetry Type.
Select
HTTPfor the communication protocol.
Click Save Configuration.
Using the CLI, run the following command:
curl -s --location --request POST
'https://api.ngc.nvidia.com/v2/nvcf/telemetries' \
--header 'Content-Type: application/json' \
--header 'Authorization: Bearer '$NVCF_TOKEN \
--data '{
    "endpoint": "YOUR_AZURE_MONITOR_ENDPOINT",
    "protocol": "HTTP",
    "provider": "AZURE_MONITOR",
    "types": [
        "LOGS",
        "METRICS"
    ],
    "secret": {
        "name": "YOUR_NVCF_TELEMETRY_NAME",
        "value": {
            "instrumentationKey": "YOUR_INSTRUMENTATION_KEY",
            "liveEndpoint": "YOUR_LIVE_ENDPOINT",
            "applicationId": "YOUR_APPLICATION_ID"
        }
    }
}'
Get Telemetry ID#
Once the telemetry endpoint is created, we need to capture the telemetryId.
Note
This step is not required for creating the function using the NVCF UI.
echo NVCF_TOKEN="nvapi-xxxxxxxxxxxxxxxxxxxxxx"
Run the following command to get the
telemetryIdof the created Azure Monitor endpoint:
curl -s --location --request GET 'https://api.ngc.nvidia.com/v2/nvcf/telemetries' \
 --header 'Content-Type: application/json' \
 --header 'Authorization: Bearer '$NVCF_TOKEN'' | jq
Copy the
telemetryIdfield for the createdazure-monitor-endpoint:
"telemetryId": "xxxxxxxx-xxxx-xxxx-xxxx-xxxxxxxxxxxx",
"name": "azure-monitor-endpoint",
"endpoint": xxx
.
.
"createdAt":xxx
Store the value in a variable called
Telemetry_ID:
export TELEMETRY_ID="xxxxxxxx-xxxx-xxxx-xxxx-xxxxxxxxxxxx"
Environment Variables#
Observability implementation uses environment variables to control Vector behavior and configuration. These variables are set during NVCF function deployment and control how the container processes logs.
Environment Variable |
Possible Values |
Function |
|---|---|---|
VECTOR_OTEL_ACTIVE |
TRUE ; FALSE / Not set |
When TRUE: Container uses Vector for log processing and forwarding to NVCF collector. When FALSE or unset: Container bypasses Vector and runs the Kit App directly using |
VECTOR_CONF_B64 |
Base64 encoded string |
Provides custom Vector configuration via Base64-encoded string |
If you provide your
VECTOR_CONF_B64value, the entrypoint decodes and uses your custom Vector configuration.When not provided, it uses the default configuration from
vector.tomlwhich is copied to the path/opt/vector/static_config.tomlinside the container.
To Base64 encode, use the following command:
base64 -w 0 vector.toml
Container to Function Flow#
Using the CLI:
curl -s -v --location --request POST 'https://api.ngc.nvidia.com/v2/nvcf/functions' \
--header 'Content-Type: application/json' \
--header 'Authorization: Bearer '$NVCF_TOKEN'' \
--data '{
"name": "'${STREAMING_FUNCTION_NAME:-usd-composer}'",
"inferenceUrl": "'${STREAMING_START_ENDPOINT:-/sign_in}'",
"inferencePort": '${STREAMING_SERVER_PORT:-49100}',
"health": {
"protocol": "HTTP",
"uri": "/v1/streaming/ready",
"port": '${CONTROL_SERVER_PORT:-8111}',
"timeout": "PT10S",
"expectedStatusCode": 200
},
"containerImage": "'$STREAMING_CONTAINER_IMAGE'",
"apiBodyFormat": "CUSTOM",
"description": "'${STREAMING_FUNCTION_NAME:-usd-composer}'",
"functionType": "STREAMING",
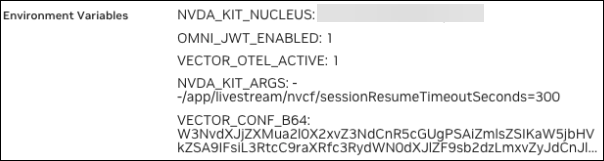
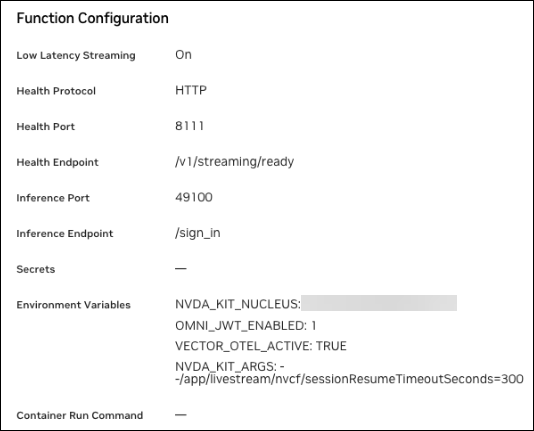
"containerEnvironment": [
{"key": "NVDA_KIT_NUCLEUS", "value": "'$NUCLEUS_SERVER'"},
{"key": "OMNI_JWT_ENABLED", "value": "1"},
{"key": "VECTOR_OTEL_ACTIVE", "value": "TRUE"},
{"key": "NVDA_KIT_ARGS", "value":
"--/app/livestream/nvcf/sessionResumeTimeoutSeconds=300"}
],
“telemetries”: {
“logsTelemetryId”: “'$TELEMETRY_ID'”,
"metricsTelemetryId": "'$TELEMETRY_ID'"
}
Using the UI:
If Base64 is used: