Basics of Audio Processing
Overview
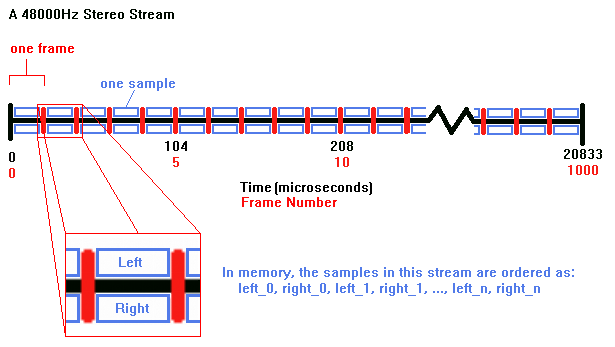
Audio data is represented in amplitude modulation by a stream of frames of data. Each frame consists of one sample per channel of data being processed. A channel typically maps to a speaker for output or a side of a microphone for input. Each sample represents the waveform’s amplitude for its channel for the current time slice. An audio stream is split into a long list of frames where each frame represents a small slice of time in the stream. Each time slice occupies the same amount of time in the stream.
A stream of audio data is laid out in memory by interleaving the samples from each channel within a frame. Each frame’s full contents will be contiguous in memory. All frames are laid out in order with no padding between them. A frame of audio data is the basic unit of processing. It is not generally possible to process a partial frame of data. Any processing operation should always occur on a frame aligned boundary. It is also possible to operate on deinterleaved data. In some situations that may allow for more optimized processing, while in others it may be more costly. In general however, many modern audio devices accept interleaved data as input so at the very least interleaving the data at some point is necessary.
Data Representation
The data represented in this stream is said to have a pulse code modulation or PCM format. This is an uncompressed format that can be readily consumed by output devices or received input sources. There are several commonly supported PCM data formats, but they only differ in the type of data container that each sample is held in. A PCM stream is described by four values:
channel count.
frame rate.
sample size.
sample container type.
Each of these values will be constant for the entire stream. Higher level processing steps may change some of these attributes, but within the original stream itself, these values will not change.
The channel count describes how many samples should be expected in each frame of data. The samples in each channel will always be found in the same order in each frame. For example, in a stereo stream, the left channel will always be the first sample and the right channel will be the second sample. Most modern devices and audio processing systems will follow the standard channel ordering defined by the Society of Motion Picture and Television Engineers (SMPTE). This defines standard ordering for some 30 or so channels and standard home speaker layouts for up to 16 channels.
The frame rate describes the rate at which the stream was originally authored and is intended to be played back at. This value is measured in Hertz and describes the number of frames of data that must be processed every second to produce exactly one second of audio. While this value is not strictly needed for decoding a stream, it is instrumental in determining its length or measuring the number of frames required to fill a time period for playback or capture.
The sample size indicates how many bits of data each sample occupies in the stream. The size of a frame in bits will be this value multiplied by the number of channels in each frame. This value is also referred to as the container size since each sample may not consider all bits in the container as ‘valid’. In cases where there are some invalid bits in the container, these will always be the lowest order bits and the sample value will be aligned high in the container. Because of this, any processing system can simply treat the sample size as the container size without any loss in quality or volume of the signal. The low invalid bits will always be treated as zeros.
The sample container type is the data type used to store and represent each sample. This can either be integer or floating point data. Note that this is also intimately tied to the sample size in a lot of cases. The most common data types are:
8-bit unsigned integer. Values range from 0 to 255 with 128 representing silence.
16-bit signed integer. Values range from -32768 to 32767 with 0 representing silence.
32-bit signed integer. Values range from -2147483648 to 2147483647 with 0 representing silence.
32-bit floating point. Values range from -1.0 to 1.0 with 0.0 representing silence.
Other formats such as 20 and 24 bit signed integer can also be found, but are less common. When an integer format is used, the full range of the sized value is used to represent the sample’s amplitude. This means that it is not possible for a sample value to go out of range. However, it does mean that if it does go out of range during processing, the sample’s value will wrap around unless it is clamped at each step. If a sample wraps around, it will cause artifacts in the stream. Floating point sample containers use the range of values from -1.0 to 1.0. These do allow for overflows without wrap-around artifacts and can typically be processed faster since intermediate clamping isn’t necessary at each processing step. This can also lead to a better quality output since information isn’t lost due to intermediate clamping.
Waveforms
Most audio streams contain a set of combined waveforms. When decomposed, these are generally smooth sine wave curves. The one common exception to this would be intentional noise where a discontinuity in the waveform would be wanted. A sine wave will be heard as a ‘pure’ tone.
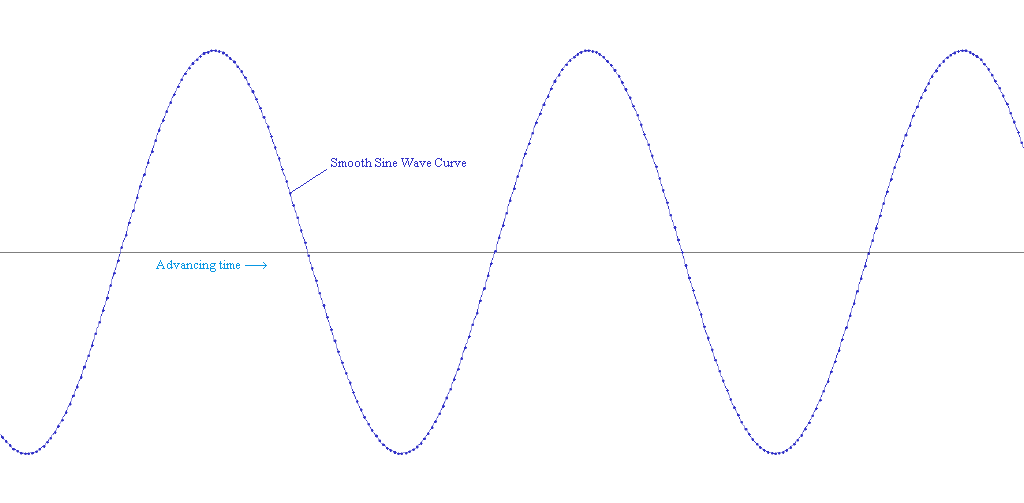
Multiple sine waves can be combined to approximate any other more complicated signal. In most cases, combining pure tones will not be used, but instead recorded or digitally manipulated sounds will be used instead.
Basic Operations
Basic audio data processing is mathematically simple. There are only a few common operations that are performed frequently:
decoding - converting the data to a PCM format that can be readily processed.
mixing - combining two sounds together.
volume changes - increasing or decreasing the volume or inverting a signal.
resampling - changing the pitch, time scale, or frame rate of the stream.
filtering - modifying the stream’s data based on a set of parameters.
Each of these operations will be discussed in detail below.
Decoding
An audio data stream can only be processed when it is represented as pulse code modulation (PCM) data. This is the stream layout format described above in the overview. Audio data may also be compressed into various formats to save memory, transmission bandwidth, etc, but that data is not directly processable. Before a compressed stream can be processed, it must be decoded into PCM data. Some audio processing systems also have a ‘preferred’ PCM format for its processing. If a PCM stream is not in the preferred format, it will need to be decoded by performing a data format conversion.
Decoding a compressed sound is a very different process depending on the format. Some common compressed formats may be adaptive differential PCM (ADPCM), MP3, AC3, FLAC, Vorbis, etc. Each of these formats has its own decompression algorithm that produces PCM data of some format. In their compressed form, these streams cannot be processed, even for simple operations like volume changes. Once decompressed, the PCM data may still be in a format that is not preferred for processing - for example, ADPCM produces 16-bit signed integer samples when decompressed. In these cases a data type conversion will need to occur as part of the decompression step.
A data type conversion changes the container type for each sample. When switching the container type, the previous sample value is scaled to match the size of the new container type. Note that this conversion may result in data loss if going to a smaller container type. For example, if going from 32-bit floating point to 16-bit signed integer, there will be approximately 15 bits of lost information (the [-1.0, 1.0] range occupies approximately half of the floating point type’s domain). The overall goal of a data type conversion is to change the container type while losing the least amount of information possible.
Volume Changes
Changing the volume of a stream (and therefore a sample) simply involves scaling it by a constant. A volume scale of 1.0 will cause no change. A scale less than 1.0 will reduce the volume linearly. A scale greater than 1.0 will increase the volume linearly. For example, a volume scale of 0.5 will cut the volume in half and a scale of 2.0 will double the volume. This scaling needs to be done for each sample in the stream for a consistent volume change to occur.
A volume value can be a negative or as well. If a negative volume is used, it has the effect of both scaling the stream by the absolute value of the volume, and flipping the waveform. This can be used to reduce constructive interference when the same sound is played multiple times with small time delays between instances. Flipping every other instance of the sound can help to prevent volume spikes on the mixed signal from occurring.
If a volume scale is applied equally to all channels in the stream, that will result in a global volume change. If a different scale is applied to each channel in the stream, it will result in an unequal volume change where each speaker’s volume will change independently. A volume change may also be applied differently frame by frame to create a ‘volume ramp’ on the stream. This can be used to gradually ramp the volume up or down.
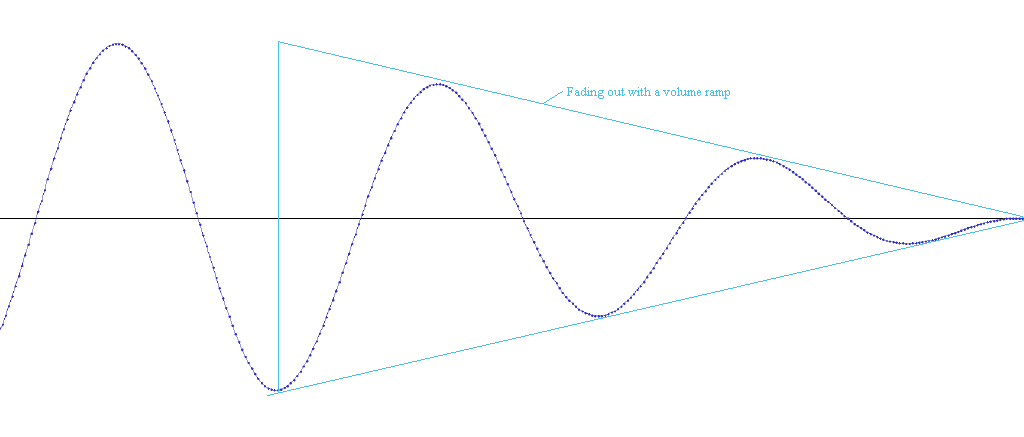
If a drastic change in volume occurs on a stream, it could result in an audible artifact in the stream. This is because the volume change results in a discontinuity in the waveform. This is heard as a ‘pop’ noise. This is avoided by ramping the volume up or down over the course of a few milliseconds instead of immediately changing the volume to the new level. Similarly, if a volume change occurs that overflows the sample container’s range, an artifact may occur. This may result in either a wrap-around artifact for integer formats or a clamping artifact occurring for floating point formats.
Mixing
Mixing two streams together is accomplished by simply adding each corresponding sample together. Within each frame, each corresponding channel’s sample will be added together (as though each frame were a vector of n channels). As long as both streams are added together equally, listening to the resulting stream will allow both sounds to be heard. An exception to this is if overflows or clipping occur due to constructive interference (ie: two very large positive or negative samples are added together and overflow the container). Another exception would be if a large amount of destructive interference occurs in the mixed stream. In this case, neither of the original streams will be able to be heard for the interfering section.

Resampling
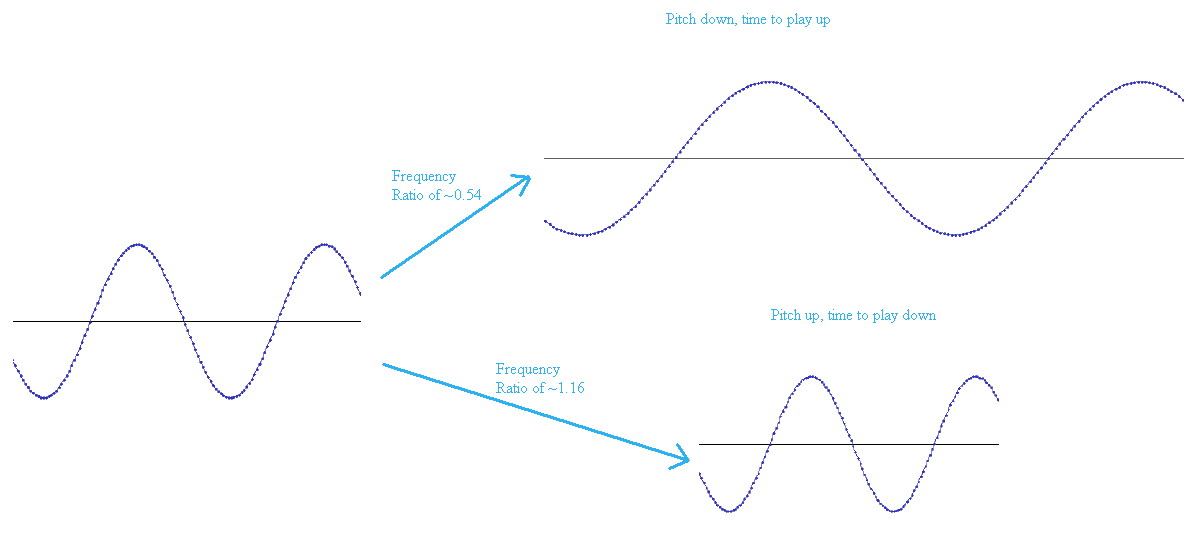
Resampling allows a stream’s length to be changed as needed largely without affecting the content of the stream. This time scaling has the side effect of also changing the pitch of the stream. Resampling is often used to do effects such as changing the playback speed of a sound, changing its pitch, doppler shift, time dilation, etc. It is also used to change the consumption rate of stream so that a device or voice that prefers a different frame rate can use it.
Resampling rates are determined by ‘frequency ratio’ or ‘time scale’ value. The frequency ratio is a way to describe how much the stream should be expanded or contracted. A frequency ratio of 1.0 will result in no change to the signal. A frequency ratio larger than 1.0 will cause the pitch to go up and more data from the stream to be consumed for the same amount of time. A frequency ratio less than 1.0 will cause the pitch to go down and consume less of the stream for the same amount of time.
Resampling a stream involves ‘redrawing’ the waveform at a different rate than the original. This can take the form of either extracting selected sample points to be part of a shorter representative version of the original, or by adding new sample points that interpolate the original waveform with a larger amount of data. In order to avoid artifacts during resampling, the interpolated data needs to also be smoothed. There are multiple ways to smooth the data and some work better than others for different ranges of frequency ratios. The overall goal of resampling is to have the new stream be as close as possible to the old one, just with a different number of samples for the same data.
Note that resampling a signal to play faster or slower can result in unrepresentable frequencies. For example, if a 10KHz signal is resampled to play three times as fast, it will result in a 30KHz signal. For a 48KHz sound, this is unfortunately unrepresentable since it is above the Nyquist frequency for the sound. This will just be heard as noise, possibly a squeal, instead of the expected signal. Similarly, if a low frequency sound is slowed down (ie: 40Hz played at one third the speed), it could fall below the frequency that is audible to the human ear. This could be heard as either a quick beating/clicking sound, or it could just be silent. The Nyquist frequency is the highest frequency that can be faithfully represented in a digital sound. This frequency limit is equal to half the frame rate of the sound.
Filtering
Filtering covers a very broad range of processing on a sound stream. The most commonly used filters are low-pass, high-pass, band-pass, and notch-pass. A low-pass filter only allows lower frequencies to pass through, high-pass allows high frequencies to pass through, band-pass allows frequencies in a range to pass, and notch-pass allows frequencies outside a range to pass. Most filters involve at least two components - a delay line of at least one frame and a gain. Some filters involve multiple delay lines and gains.
A delay line is simply a buffer that stores a history of the last n frames of data in the stream. This is usually treated as a looping buffer if the delay line’s length is more than one frame. The filter applies changes to the stream by analyzing the delayed data and applying a transformation using it and the incoming stream. A gain is simply a volume change on the stream.
Most filters can be categorized as either a finite impulse response (FIR) or infinite impulse response filter (IIR). These can typically be differentiated by checking if the output data is also fed into a delay line that then affects the incoming stream. If the output data is delayed, it is typically an IIR filter. FIR filters typically only operate on the history of their input stream.
A filter can be expressed as a block diagram or a computational formula. The block diagram shows the flow of values and operations through the various delay lines, gains, and mix points. A delay line is typically represented by a rectangle with the term Z^-n^ (where n is the length of the delay line in frames). A gain is represented by a triangle containing the gain term. The formula for the filter can be derived from the block diagram or vice versa.

Latency
An audio processing system needs to process data in small chunks. Each processing step can potentially require some overhead (ie: buffer space, decoding setup, resampling history, etc), or some minimum processing requirement (ie: decoding an ADPCM block produces a fixed number of frames). The size of the processing chunk can be as little as one frame or as large as several milliseconds. The chunk size determines the minimum latency of the processing system - this much data must be produced before it can be sent anywhere (such as a device for playback). Once sent, the device then requires that amount of time (the chunk’s length) to play the chunk before moving on to the next one. Even if the processing system were infinitely fast, its next chunk would still not be processed by the device until the first chunk was consumed.
Audio processing on real audio devices is a real-time task. The processing system has exactly the length of the processing chunk to produce one chunk of data for playback. Unlike graphics processing where a correct (at least for the given inputs) result will always be produced eventually regardless of processing rate, audio playback will fail and starve the device if its processing takes too long. This starvation will lead to an audible artifact and an incorrect result.
To get around this and other related issues, audio processing systems typically queue up several chunks of data on a device and attempt to maintain a particular level of pre-buffered data at all times. Many devices will be happy with 2-3 chunks of pending data to work with. As long as the processing system can keep up with that rate, playback should proceed without issue.
There is typically a trade-off between processing efficiency and the latency introduced by the size of each chunk. Depending on the processing resources of the platform, a typical chunk size may be anywhere from 1 to 10 milliseconds worth of data. The smaller the chunk size, the more overhead for processing the chunk may be incurred, but there is also less to process overall. Note that these chunk sizes require processing cycle rates of 100Hz to 1000Hz, which is generally far in excess of any graphics frame rate, so efficiency in processing is very important.
The total latency of the system is measured as the time from when a frame of data is decoded to when it is heard from the speakers. Each layer of processing on the way to a real audio device can add its own small amount of latency to the system as well (ie: going through a system API that also caches data). Most low level audio APIs try to add as little latency as possible.
Note that it is generally not programmatically possible to accurately measure the full latency for a system. This is because once the chunk is passed off to the system’s low level API, all that typically occurs is a callback or notification that the chunk was consumed by the device. There is however no guarantee that this notification occurs in a timely fashion, or either before or after that chunk’s sound actually comes out of the speaker. Many low level APIs handle these notifications differently and generally do not offer any guarantee of timing. For example, due to system load or other reason, multiple notifications for chunk completions may be delivered simultaneously even if all of them have been fully consumed by the device [relatively] long ago.
Audio Graphs
An audio graph is a way of representing the way data can flow through an audio processing system. Each audio processing system has its own set of rules and restrictions for their audio graph. Most often these rules and restrictions come out of necessity for efficiency of processing the data. When one processing chunk of audio data (as described above) makes a full trip through the audio graph, a ‘cycle’ is said to be completed. At this point, a single chunk of fully processed audio data will be available on the mastering voice to be sent to an output. An output may be something such as a real audio device, a file, a network stream, or even the input queue of another voice.
All audio graphs have a few things in common - an input layer consisting of ‘voices’ or ‘sources’, and an output layer consisting of a mastering voice or output. The simplest audio graphs consist of just these two layers - for example, DirectSound. More complicated processing systems may also add additional processing layers where effects, filters, collective volume changes, spatial audio, etc can be applied.
Some audio graphs only allow data to travel in one direction, never feeding back on itself. These are called acyclic audio graphs. Others can feedback their processing results to other parts of the input as needed. These are called cyclic audio graphs. Acyclic audio graphs are most often found in software SDKs whereas cyclic audio graphs are often found on game consoles where dedicated hardware exists.

Frequencies & Playback
Each audio stream has a frame rate associated with it. This is the frequency that the stream was originally authored at and is expected to be played back at. Within this stream, the maximum frequency that is faithfully reproduceable is half the frame rate. This is called the Nyquist frequency. So for a 48KHz stream, the maximum frequency would be 24KHz. Any frequencies beyond this limit will just be heard as noise in the signal.
The human ear is capable of hearing and perceiving sounds in the range from approximately 20Hz to 20000Hz. Any output device that filters out frequencies above 20000Hz can faithfully reproduce these signals from a digital stream. Historically, one of the reasons why 44100Hz was chosen as a standard audio broadcast frequency (analog television) was that it could be used to represent all human perceivable sounds and still have extra error space to account for low-pass filter rolloff when using a cut-off frequency of 20000Hz.
Glitches & Artifacts
If audio processing is not done correctly or in a timely manner, audible problems may be introduced into the audio data produced. There are two major types of problems that can be heard - glitches and artifacts.
Glitches
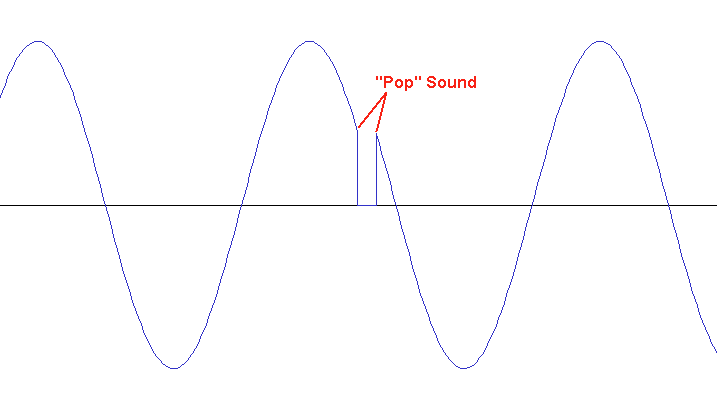
A glitch occurs when the production of audio data cannot keep up with the consumption rate of the output. This is the case for both capture and playback devices. On the capture side, if the incoming data cannot be produced fast enough to satisfy the needs of the processing side, a gap may be introduced (though this is rare on the capture side). On the playback side, if new audio data cannot be produced fast enough to keep pace with the device, a gap will also be introduced. When looking at a waveform capture of this, a gap can usually be clearly seen. Note however that if the stream that is being sent to the device is captured, it will look flawless. However, a capture of the device’s output (ie: through a loopback capture) will show the gap. Audibly, this type of error will be heard as a set of quick ‘pop’ sounds. The number of pops depends on how many dropouts there are over a short period of time. If the pops are frequent and regular enough over a long period of time, this will be heard as ‘static’.
Artifacts
Artifacts occur when an error in processing the audio stream occurs. These can take many different forms. The most common of these are:
ring buffer artifacts.
wrap-around artifacts.
discontinuity artifacts.
zero crossing artifacts.
clipping artifacts.
Ring Buffer Artifacts
A ring buffer artifact occurs when a small buffer is being used as a streaming source and it cannot be filled fast enough to keep up with the playback. The result of this is that a short chunk of old audio is played again. It is possible to recover from these artifacts by resynchronizing the read and write cursors in the buffer. The main cause of this type of artifact is when the production of new audio data stalls and the device’s read cursor walks into the chunk of the buffer that is currently being written to. The device’s read cursor generally moves at a steady predictable pace, but the audio production rate can vary depending on many factors.
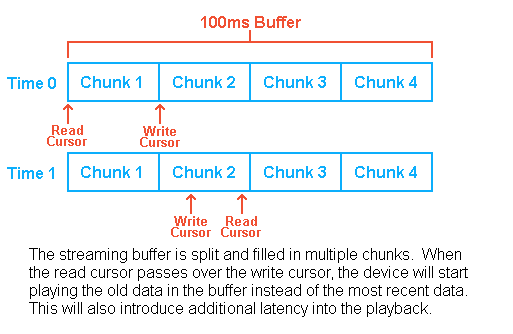
A ring buffer artifact can be avoided in one of many ways:
halt the device output if the read cursor is detected passing over the write cursor. This will still introduce a glitch into the output, but at least it won’t be repeating old audio. The device can be resumed once sufficient lead time on the write cursor has been achieved.
when a cross-over event is detected, immediately discard the current chunk, write some silent data into the following chunk or two, then resume writing of valid data to the chunk after that. This gives the write cursor some lead time over the read cursor.
allow the current cycle of the buffer to complete and catch up to within one chunk of the write cursor again. This will bring the latency back down to normal and allow the streaming to be retried.
Wrap-Around Artifacts
A wrap-around artifact occurs when processing integer based audio streams without clamping after each calculation or using larger sample containers. This occurs when an integer calculation overflows and wraps around. Since integer sample formats occupy the full range of the value (ie: 16-bit samples range from -32768 to 32767), there is no room to accept overflow and no reliable way to detect and correct it after the fact. This type of artifact is most often heard as static or a series of loud pops during the period where the wrap-arounds occur.
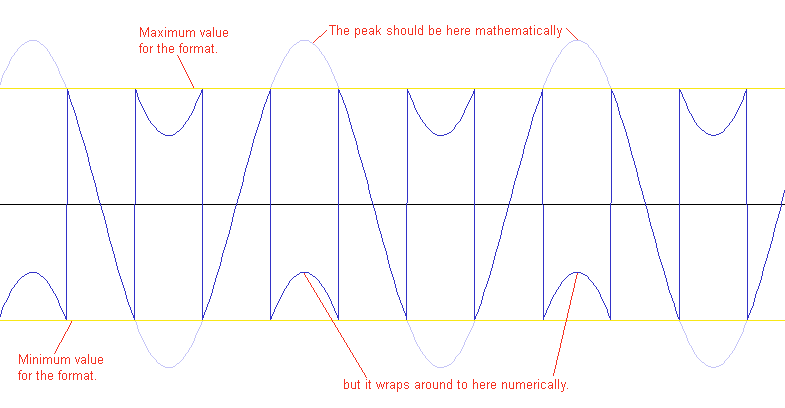
This is commonly fixed by either clamping integer calculation values before writing them to the output buffer, or by performing all intermediate calculations in a buffer that uses larger sample containers (ie: processing 16-bit samples in 32-bit containers). The former method is less efficient because it requires per sample branching and clamping. The latter method only requires clamping once at the final step before output.
Discontinuity Artifacts
A discontinuity artifact generally occurs when there is an error decoding a stream. This results in the [relatively] smooth waveform making a large jump in amplitude within just one sample. This is often heard as a pop or quick squeal depending on the magnitude of the jump.
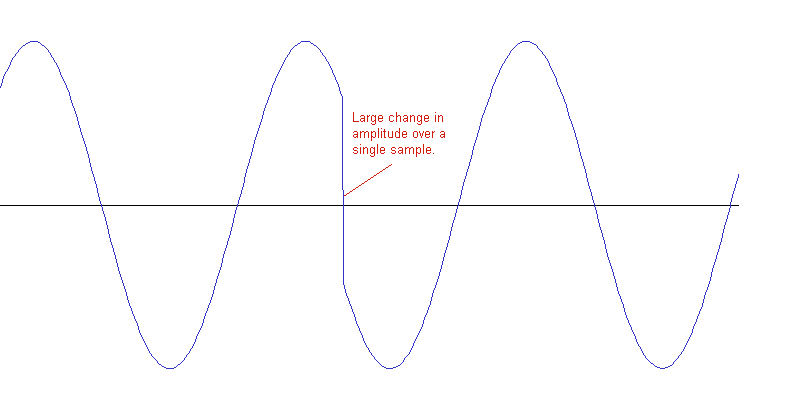
In general the only way to avoid this kind of artifact is to track down either the bad data or bad decoding step that is causing it. This is often a difficult process and requires a lot of debugging efforts.
Zero Crossing Artifacts
A zero crossing artifact occurs when a stream either starts or stops at a point that is not at a silent sample value (zero for most formats, 128 for an 8-bit unsigned integer format). This is a special kind of discontinuity artifact that is most often seen when a stream is started at full volume at some point other than its start or is paused without first ramping down the volume. This is heard as a single pop sound. The volume of the pop depends on how far away from zero (or silence) the first or last played sample is.
The general way to avoid this is to fade in streams that are not starting at the beginning of their asset and fade out streams before they are stopped or paused before their end. There is no other safe way to avoid these artifacts without first analyzing each stream to find a safe stop point where a zero sample already exists. Doing so would be rather inefficient and would require either luck to find a zero sample value near the requested stop point or modifying the asset to insert a zero sample.
Clipping Artifacts
A clipping artifact occurs when the waveform would have gone out of bounds of the format’s numerical range but was clamped to fit the range. This is often heard as a distortion of the stream. If the clipping artifact goes on for a long period it will sound like loud static. The sound of the artifact will change depending on how far out of the format’s numerical range the unclamped stream goes.
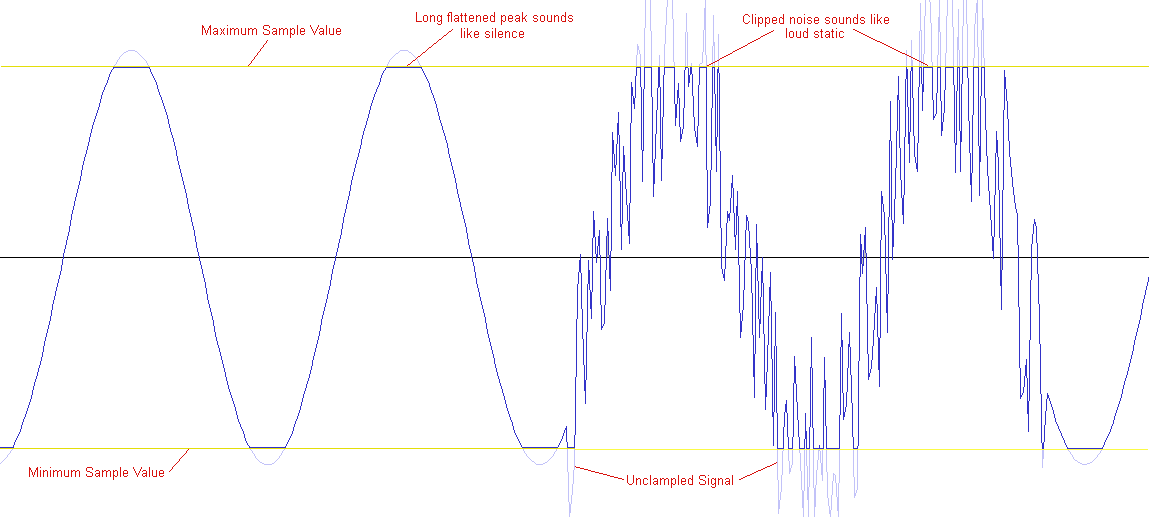
In general when a large amount of clipping occurs, it is an indication that the mixed stream was too loud overall. This can occur from a lot of constructive interference or from the incoming signal just having been mastered too loudly. The best way to avoid this type of artifact is to have a final global volume pass before any clamping occurs on the raw mixed signal. If an integer format (with larger sample containers) is used this would need to occur before the final output buffer is converted back to the destination format (ie: taken out of the larger containers). This conversion pass is generally combined with the clamping pass anyway.
Spatial Audio
Spatial audio attempts to simulate sound traveling through space by varying volume levels and positioning sounds in some speakers more than others. This gives the illusion to the listener that a sound is coming from one certain direction instead of always being all around the user. In order to simulate this, the audio processing system must have a knowledge of the user’s speaker layout. In general it is assumed that one of many standard SMPTE speaker layouts is being used. For example, the user could be using a layout such as stereo, quadrophonic sound, 5.1 surround sound, 7.1 surround sound, 7.1.4 surround, etc. With a knowledge of the relative location of each of the speakers in real space around the user, the audio processing system can position the virtual world’s sounds to one or more of the speakers to simulate directionality.
Due to the wave nature of sound, physically accurate simulation of sound is very computationally expensive. Most applications of sound processing in simulations (ie: games, virtual worlds, etc) are expected to use a very small slice of time when compared to other calculations such as physics, graphics, game/simulation logic, etc. Further, unlike graphics and physics whose simulations will complete eventually and correctly regardless of how long they take (at least correctly given their accurate inputs and calculation methods), audio processing is a real-time task and must produce at least one second of audio data every second. Failing to do so will result in a glitch. Most users are much more forgiving of bad or incorrect visuals than they are of spotty or static laden sound. It is thus very important that audio data be produced as quickly as possible in order to keep up with the playback demand of the device.
In order to still be able to simulate a convincing aural world, many cheats are often used. These cheats usually take the form of a group of individual effect passes or simplifications of the physical behaviour of sound. This could include only simulating the direct path of sound, simulating reverb with a generic room model, calculating doppler shifts through simple frequency changes, etc.
Distance Simulation
All spatial audio systems require knowledge of the location and orientation of two types of objects in the virtual world - the listener and one or more emitters. The listener represents the location of the user in the virtual world and can be thought of as a microphone (or group of directional microphones - one channel per speaker). The emitters represent objects in the virtual world that will produce sound at some point. An emitter will often produce a single channel stream of data that will then be split to multiple channels in the final output.
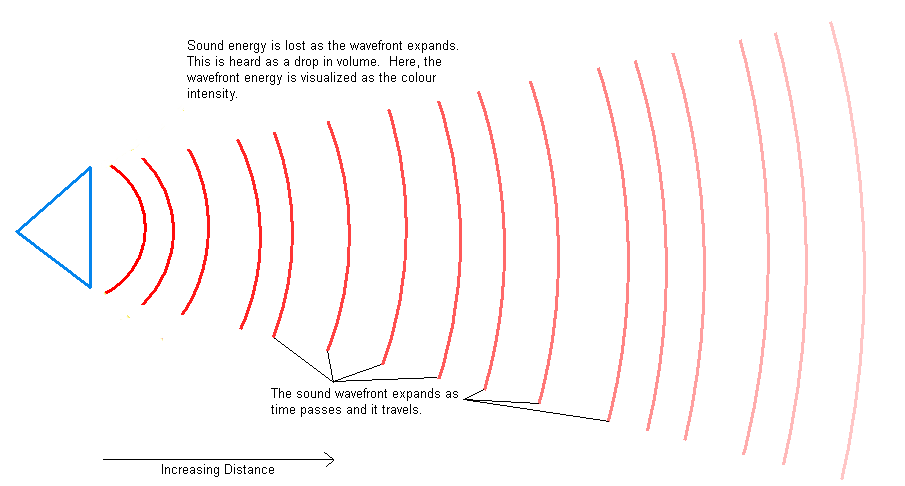
The position of the listener relative to the emitter(s) is used to determine the distance and direction. The distance is used to calculate the volume attenuation to apply to the emitter’s sound stream. As the distance between the listener and an emitter increases its volume level will drop off predictably. This simulates the loss in power as the sound’s wavefront grows. If the listener is outside of the emitter’s range, the sound will not be heard.
The distance from an emitter to the listener can also be used to calculate a distance delay effect. In air, sound travels approximately one million times slower than light does. This means that when an emitter that is a long distance away is accompanied by a visual cue, the visual cue will be seen long before the related sound is heard. This can be simulated by delaying the start of a sound based on the calculated distance between the listener and emitter. As an example, a sound travelling in air propogates at approximately 340 meters per second. This means that (if loud enough) it will take approximately 2.94 seconds to travel one kilometer. These calculations are typically complicated in other media by the fact that the speed of sound increases as the density of the travel medium increases, but the speed of light decreases as the density of the medium increases. These differences are often discarded as insignificant as a cheat however.

Directionality Simulation
The calculated direction of the emitter relative to the listener is used to determine which of the speakers the sound should be heard from and at which volume levels. The angle between the listener and emitter is taken relative to the front center speaker and is used to determine a pair of speakers that the sound should most effect. The relative volume levels between these two speakers is then interpolated using the angles of each of the speakers in the pair versus the listener to emitter angle. This simulates the direct path of the sound to the listener. Opposing speakers can also receive a quieter filtered version of the same sound, but slightly delayed, to simulate the sound on the reverb path.
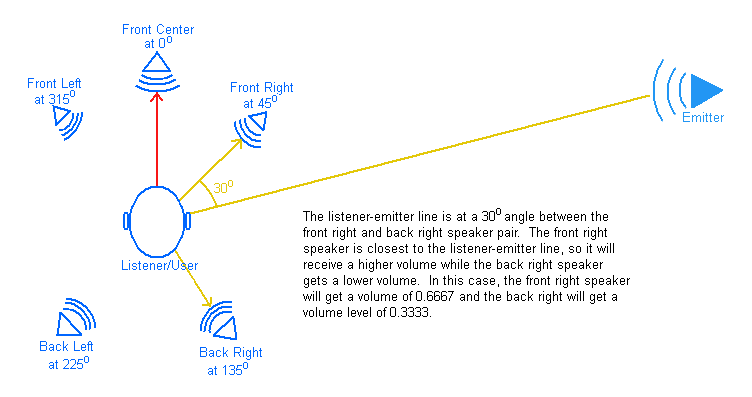
The orientation of the listener is always required. This helps to determine which direction in the virtual world should map to the front center speaker in the real world (or the relative position of the front center speaker if it is not part of the current speaker layout). The orientation of emitters is optional however. The orientation of an emitter or listener is typically given by a pair of vectors in the virtual world - a ‘front’ vector and a ‘top’ vector. The front vector is the direction that the listener or emitter is facing and the top vector is the direction of ‘up’ for it. An emitter’s orientation is generally only necessary when it has a directional cone applied to it. The cone specifies that the sound from the emitter can only be heard for a limited angle sweeping out from its front vector. Outside of this sound cone, nothing from the emitter can be heard. A listener can also have a sound cone. The difference is that the listener’s cone determines the range of angles that the listener can hear anything from. This helps to simulate effects such as hearing sounds through a doorway.

Velocity Simulation
The listener and emitters can also be provided with an optional velocity vector. This can then be used to calculate a doppler shift effect on the emitter. The doppler shift changes the frequency of the emitter’s sound as it either approaches the listener or moves away from it. This is due to the compression or expansion of the wavefront of the sound as it approaches or recedes.
Physically, the doppler shift calculation involves calculating the new frequency for the sound given the relative velocities of the listener and emitter. Unfortunately, an audio stream generally contains constantly changing frequencies. Handling this physically accurately would require first analyzing the stream to calculate the various frequency(ies), and then calculating and adjusting the frequency per sample. This is very expensive to do computationally. Instead a frequency shift factor is calculated and applied to the stream as a whole. This will either speed up or slow down the entire stream in a uniform way for the current time slice.
The doppler shift effect is accomplished by calculating a ‘doppler factor’. The doppler factor is only concerned with the relative velocity between the emitter and listener. This is calculated by projecting each of their velocity vectors onto the line between them and then summing the vectors. The doppler factor is then calculated using the following formula:
Note that velocities over the speed of sound greatly change the behaviour of doppler shift calculations. These cases are generally not supported in audio processing systems however for various reasons. The most important reason is usually that as the velocity increases, the doppler shift factor generally grows to a point where using it to resample the stream would result in far more noise and corruption than actual resamled signal in the stream. Thus capping the doppler factor to something that will produce a resampled signal that is close to the stream’s maximum representable frequency is generally used as a cheat. A sonic boom simulation is generally then faked once the velocity reaches the sound barrier.
Obstruction Simulation
An obstructions between the listener and emitter can effect the frequencies that arrive at the listener. An obstructive object blocks frequencies whose wavelengths are on par or smaller than with the depth (along the line between the listener and emitter) of the object. In general this means that obstructions will block higher frequency sounds the most.
A common way of simulating sounds passing through an obstruction is to apply a low pass filter to it. This gives the user the impression that the sound is not arriving on a direct path (along with other cues such as time delays, reverb, etc). The filter’s cutoff frequency will usually be set based on the approximate size or thickness of the obstruction, or based on some user defined transmissivity or reflectivity values assigned to the obstruction.
Channel Mapping Simulation
Most spatial sounds start as monaural. They are then spread to one or more speaker channels in the final output. This spreading is done through the use of a channel mapping matrix. Other operations in an audio graph can also change the channel mapping in similar ways.

A channel mapping matrix is sized to match the source and destination channel counts for the stream. Each entry in the matrix represents the volume level to apply from one of the source channels to one of the destination channels. Each vector along the destination side of the matrix can be thought of as the combination of volume levels from all the source channels that contribute to that single destination channel. The volume levels in each destination vector generally add up to 1.0. If they do not add up to 1.0, there is typically an overall loss in sound power from the transition from the source channels to the destination channel.