Debugging#
Linux Debugging#
Carbonite 151.0 added include/carb/carb-gdb-printers.py which are pretty-printer and command objects for GDB to print formatted versions of some Carbonite objects. Also available are some commands that can be used to aid debugging:
task list- Lists all carb.tasking taskstask bt <task>- Prints the current backtrace for the given tasktask aggregate- Prints an aggregation of all tasks by the task functiontask creationbt <task>- Prints the backtrace that created a task, if enabledtask threads- Prints what each carb.tasking task thread is doingfiber list- Lists all fibers in usefiber bt <fiber>- Liketask bt, but with a fiber instead
Windows Debugging#
For debugging usage of the carb.tasking plugin, there are some easy tricks that can get you started. In general, debugging on Windows with Visual Studio 2019 or later is recommended as GUI tools like Parallel Stacks and NatVis Visualizers can make problem visualization easier. Debugging with VSCode or GDB is far more challenging.
Warning
Visualizers are only supported on Microsoft Visual Studio 2019 or later with the carb.natvis file present. At the time of this writing, Visual Studio Code does not support the full NatVis language necessary to support carb.tasking visualizers.
Add the following to your Visual Studio Watch window:
carb.tasking.plugin.dll!CarbTaskingDebug
This should have a special visualizer in carb.natvis that will display carb.tasking debug information:
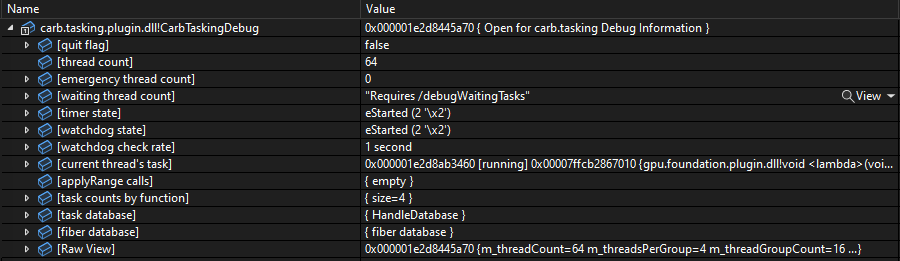
This high-level debug view gives the most common information necessary to debug asynchronous tasks:
[quit flag]- Will betrueif carb.tasking has been asked to exit,falseotherwise.[thread count]- The base number of threads that carb.tasking is using to process tasks.[emergency thread count]- If the Watchdog determines that carb.tasking is stuck, emergency threads may be started to make forward progress.[waiting thread count]- If the debugWaitingTasks setting istrue, this is the number of threads spawned to wait for tasks.[timer state]- Indicates if the timer is running. This occurs whencarb::tasking::ITasking::addTaskIn()orcarb::tasking::ITasking::addTaskAt()are used.[watchdog state]- Indicates if the Watchdog is running. This occurs if the stuckCheckSeconds setting is a positive amount.[current thread's task]- If the debugger is currently in acarb.task XXtask thread, this will be the task that is currently running.[applyRange calls]- This is a list of allcarb::tasking::ITasking::applyRange()calls requested of carb.tasking. See ApplyRange Calls for more info.[task counts by function]- Lists the count of current tasks by task function. Once a task is completed and its handle has expired, it is no longer counted. See Task Counts for more info.[task database]- Lists all tasks, with theircarb::tasking::TaskContexton the left, and a summary on the right. Each item can be expanded to see additional information about the task. See Showing All Tasks for more information.[fiber database]- (Advanced) Shows all of the fibers currently allocated.
ApplyRange Calls#
The carb.tasking system considers carb::tasking::ITasking::applyRange() calls to be the highest priority since
they must finish before returning to the caller. All applyRange calls that have been requested appear in a list under
[applyRange calls]. This function may be called recursively, so there may be many items in this list. However, the list
is processed in order, so the requests at the top of the list come first.
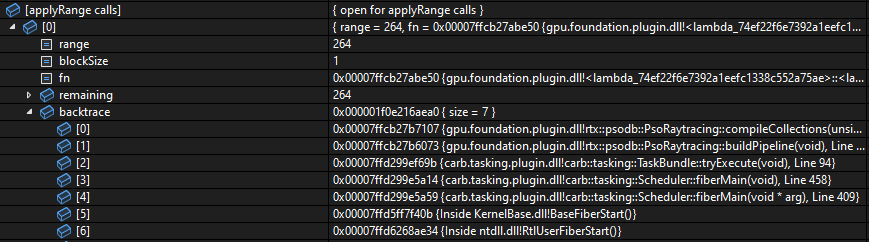
The following items are presented:
range- The number of items in the range.blockSize- This is the number of items that form a block: a contiguous group of items that will be processed by one thread.fn- The function passed toapplyRange.remaining- The approximate number of items remaining to be processed. Note that some of these items may currently be being processed.backtrace- If the debugTaskBacktrace setting istrue, this will record a backtrace of the call toapplyRange.
Task Counts#
Inspecting the state of the system generally starts with the question, “What is the most requested task?” This is what the
[task counts by function] CarbTaskingDebug visualizer shows. This is a mapping of task function to count of open task handles.
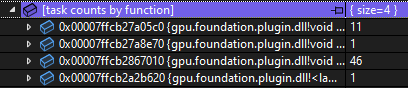
In this example, we can see that task function 0x7ffcb2867010 has the most entries at 46. We might want to look at some
of these tasks under the [task database] key to see what state they are in.
Showing All Tasks#
You can see a list of all tasks known to carb.tasking.plugin by opening [task database] from the CarbTaskingDebug visualizer.
When using the carb.natvis file that ships with Carbonite, this allows inspection of all tasks currently known to the
tasking system. The TaskContext (handle) identifying the task is shown under the Name column. The Value column for a
task shows a state followed by the function that the task will execute. The tasks can be opened further in the debugger
to see additional info about the task.
The possible task states are as follows:
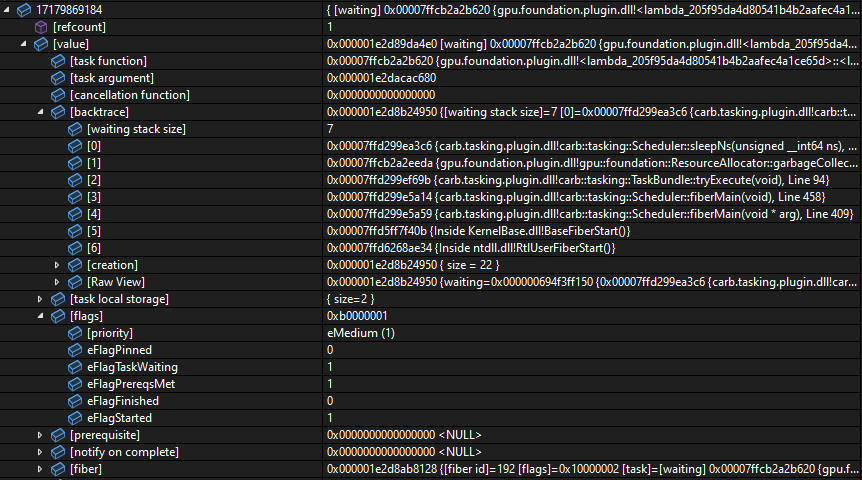
[pending]- This task has unmet prerequisites, so it cannot be started. The prerequisite is shown under the[prerequisite]visualizer member.[new]- This task is ready to run and is waiting for an available worker thread. A fiber typically has not been assigned to this task yet.[running]- This task is currently running on one of the worker threads.[waiting]- This task has started but is waiting. If debugTaskBacktrace is enabled, the waiting callstack is available under[backtrace] / [waiting].[finished/canceled]- This task is finished or canceled. This entry is uncommon as typically the task would be released at this point, but something is retaining a reference to the task.
Additional information is available when expanding the task:
[name]- The task name, set bycarb::tasking::ITasking::nameTask().[task function]- The function to execute for the task.[task argument]- Avoid*context that is captured and passed to the task function.[cancellation function]- A function that will execute if the task is cancelled before it is started.[backtrace]- If debugTaskBacktrace is enabled, this will show a[creation]callstack member that records the callstack that requested the task. If the task is waiting, there will be a[waiting]member that shows the callstack that triggered the wait. See debugTaskBacktrace.[task local storage]- Shows any task-local storage in use by this task. Seecarb::tasking::ITasking::allocTaskStoragefor information on task storage.[flags]- (Advanced) Task flags used internally by carb.tasking.[prerequisite]- If a task is pending, this will be a pointer to the prerequisite that must be satisfied before the task can start. See Task Prerequisites.[notify on complete]- (Advanced) This is an internal object that will be notified once the task is complete.fiber- (Advanced) The fiber assigned to run this task.
Task Prerequisites#
“Sub-tasks” created with carb::tasking::ITasking::addSubTask() pass a requiredObject parameter that must be
signaled (or completed) before the sub-task can execute. Similarly, throttled tasks created with carb::tasking::ITasking::addThrottledTask()
must obtain a count from a carb::tasking::Semaphore before they can begin. These required objects and semaphores
are considered by carb.tasking to be prerequisites.
If a task has a prerequisite, it will be shown in the [prerequisite] field:
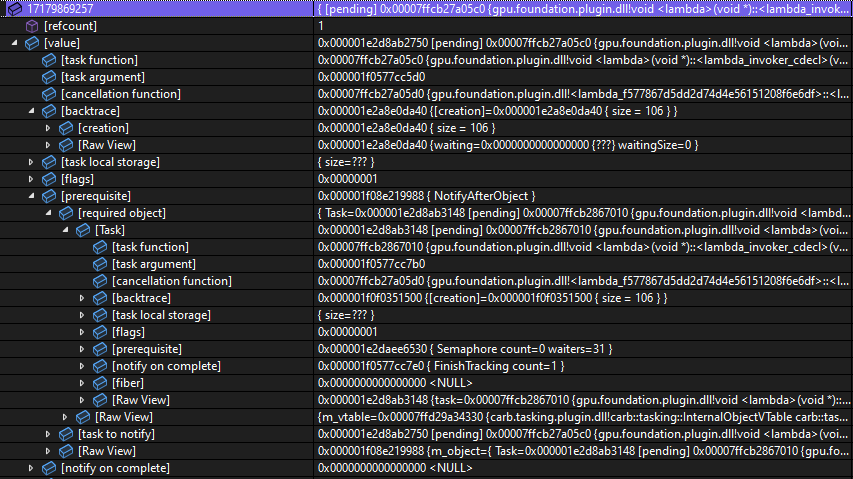
Typically the prerequisite is typically one of the following internal object types:
NotifyAfterObject- The[required object]field represents the object that the task is waiting on. If a semaphore was also specified, there will be a[required semaphore]field as well.TimerAddTask- Indicates that a task was queued withcarb::tasking::ITasking::addTaskIn()orcarb::tasking::ITasking::addTaskAt()and is pending on a timer.
debugTaskBacktrace#
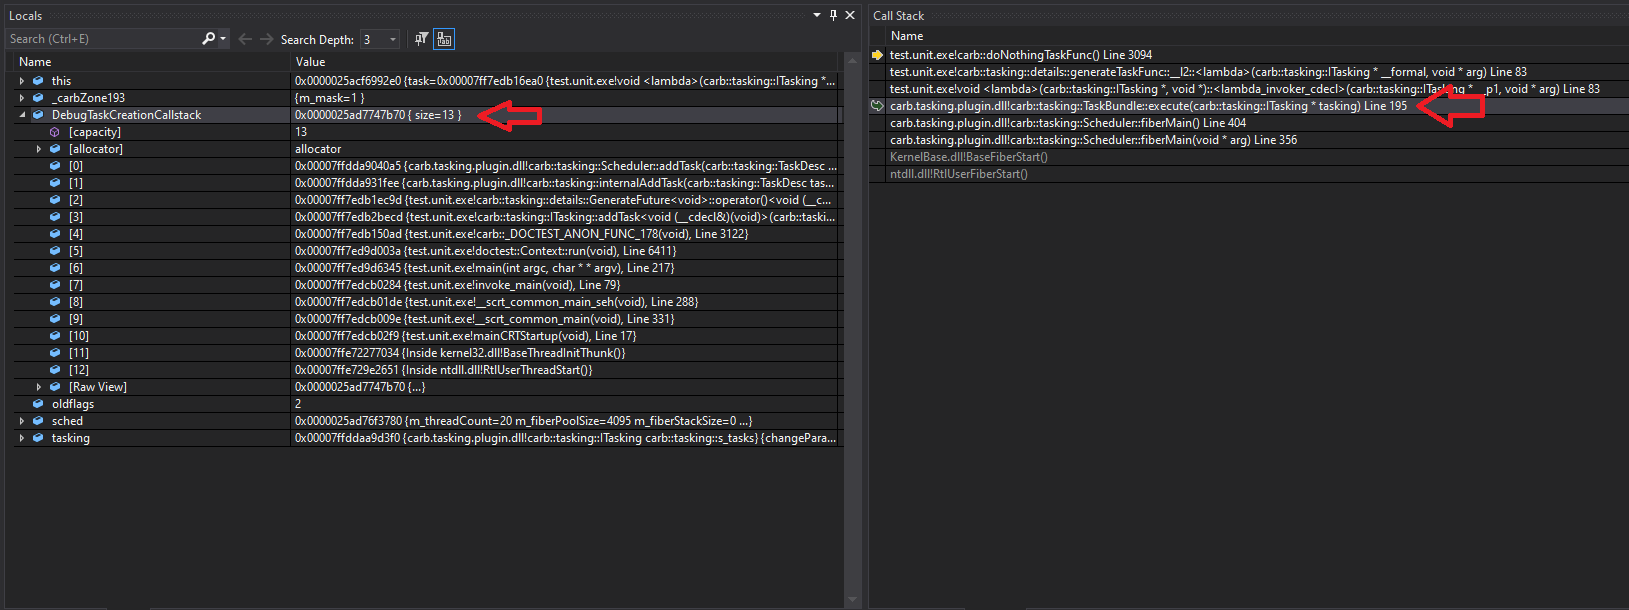
It can also be difficult to identify a task or what queued the task. This is why the debugTaskBacktrace debug setting
exists. When symbols are available this will capture the callstack that spawned the task. When a task is actively running
on a worker thread the carb::tasking::TaskBundle::tryExecute() frame of the callstack will have a DebugTaskCreationCallstack
local variable that will be the callstack that created the task. For tasks that are off-thread and waiting, the callstack
leading up to the wait is also captured.
Unsafe Mutex Locks#
debugLocks (Windows only)#
If the debugLocks setting is true, the carb.tasking plugin will attempt to hook functions
for manipulating SRWLOCK and CRITICAL_SECTION objects that provide thread-based locking and typically are the
foundation for higher level locks such as std::mutex. If an unsafe mutex lock is held across a task context switch
(which will cause errors if the task is resumed on a different thread) an error log is printed and a CARB_RELEASE_ASSERT
assertion occurs.
debugAlwaysContextSwitch#
Another setting, debugAlwaysContextSwitch, helps to catch unsafe mutex behavior by causing a task to switch to a different thread at every possible context switch location, even if a context switch would not normally occur (such as if a mutex could be immediately locked). Issues may still be masked if random chance causes a task to hold a lock, context switch to a different thread and then back to the same thread before unlocking. However, it is recommended that non-performance-intensive tests be run with this mode to identify potential unsafe behavior.
Pinned threads and certain applyRange calls are excepted from this debug feature due to how they work.
suppressTaskException#
If the suppressTaskException setting is false (or if a debugger is attached before
carb.tasking.plugin is started) then any unhandled exceptions are not caught by carb.tasking.plugin and will either
stop the debugger or proceed to std::terminate. Many std::mutex implementations will throw if an unlock
attempt is made by a thread other than the owning thread.
Last resort: Pinning#
If an unsafe mutex lock cannot be solved by the above methods, the task can be pinned to the current thread by using
carb::tasking::PinGuard. This will “pin” the task to the executing thread so that it will always resume on
that thread. Note that this can have performance implications. Read the documentation for PinGuard before using!
Debugging Deadlocks#
The carb.tasking plugin works with a thread pool that has a limited number of threads. If all of these threads become blocked then the system will deadlock.
Emergency Threads#
By default, if carb.tasking sees a certain amount of time pass and no tasking threads have yielded their current fiber
while other fibers are ready to resume (note: this does not include new tasks), it considers itself “stuck.” When this happens, it will issue a log warning (carb.tasking is likely stuck)
and start an emergency worker thread. The emergency thread will select the next available fiber to resume and exit once
the task yields or finishes.
Note
This behavior is controlled by the setting key stuckCheckSeconds.
Running out of Fibers#
If the number of fibers has been limited due to a carb::tasking::ITasking::changeParameters call, or an
excessive number of tasks have started but are waiting, the system will starve for lack of fibers. This can be identified by warning log messages that state “Out of fibers; too many tasks are waiting.”
If this message is appearing in the logs, it can be helpful to show all tasks and see what the [waiting]
tasks are waiting on.
In general, it is much more efficient to use carb::tasking::ITasking::addSubTask() to wait on a carb::tasking::RequiredObject
than calling a wait function from within a lambda. The former does not require a fiber until the RequiredObject becomes
signaled, whereas the latter requires a fiber which is then suspended until RequiredObject becomes signaled.
Waiting in a non-Fiber-Safe Manner#
Deadlocks can also occur when all worker threads are running tasks that are waiting in a non-fiber-safe manner. For instance,
all worker threads could be running a task that awaits a std::condition_variable (which is not fiber-safe). However,
the task that would signal the condition_variable and release a task cannot resume because all task threads are busy. In
this case, using a fiber-aware primitive such as carb::tasking::ConditionVariableWrapper will allow the worker
threads to run other tasks while a task is blocked. The carb.tasking plugin provides many synchonization primitives that
are fiber-aware, and many are direct replacements for std or carb primitives.
Another example that can lead to deadlocks (or general slowness) is multiple tasks waiting on I/O. By having a task wait on
I/O, the task thread running it cannot execute other tasks. A possible solution is to have a dedicated I/O thread. Tasks can
wait in a fiber-safe way by calling carb::tasking::ITasking::suspendTask, allowing the worker threads to perform
other work. Once the I/O operation is complete, the dedicated thread could wake the task with carb::tasking::ITasking::wakeTask.
debugWaitingTasks#
Waiting tasks are typically not visible to the debugger, but there exists a debug setting: debugWaitingTasks.
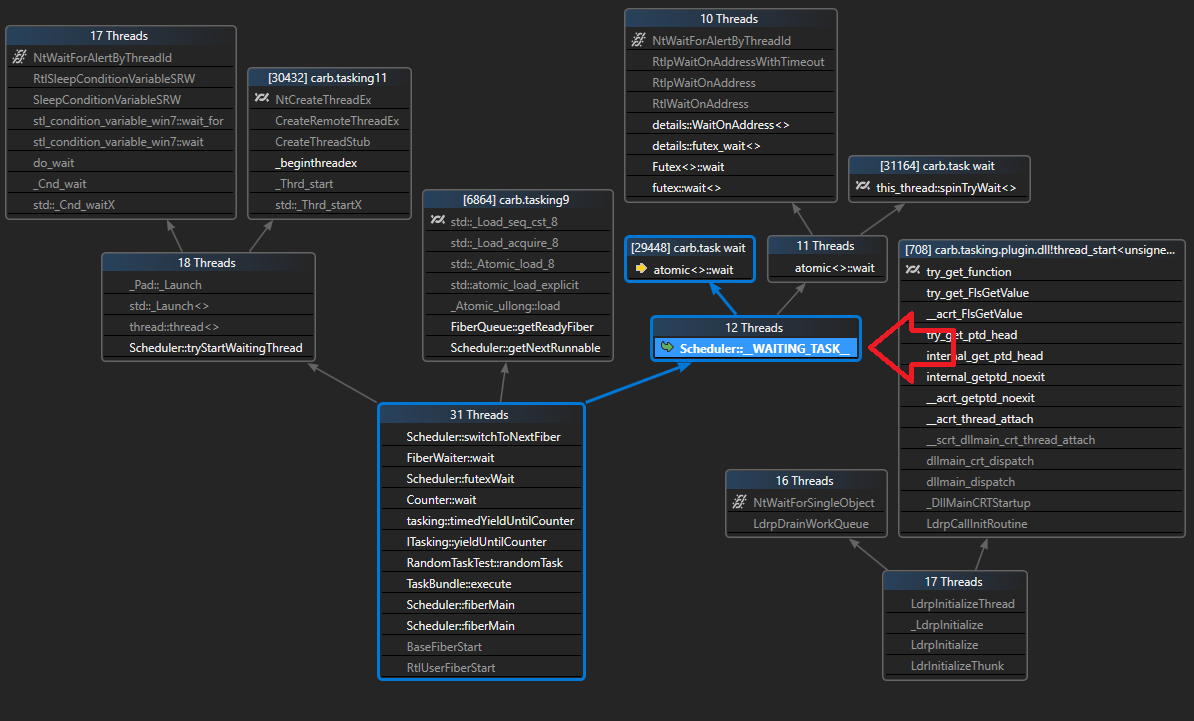
This setting is very performance intensive but will allocate a thread for each waiting task so that they can be viewed in Visual Studio’s Parallel Stacks display.
With this setting enabled, each waiting task is visible as a separate thread with Scheduler::__WAITING_TASK__
in its callstack.