Profiler Window
omni.kit.window.profiler
Introduction
This extension brings together in a single window a range of profiling-related functionality available in Kit and it’s subsystems
Once the extension is enabled, the window can be opened by clicking on Window->Profiler in the main menu bar, or by pressing F8.
It provides access to a number of different profiling systems, including:
carb::profiler (for native CPU code)
GPU Profiler
PerfSDK GPU Profiler
Python cProfile Profiler
Python carb::profiler (omni.kit.profile_python - adds python support to carb::profiler)
Pixar Trace Profiler for USD/Hydra
The APIs and command line aspects of these are discussed in Kit Developer Documentation but here is a brief overview:
carb::profiler
This is the “core” Kit Profiler - It outputs timings for code spans or zones (based off instrumented functions in the Kit source code and it’s dependencies) in a few different modes/formats:
CPU - writes to chrome trace json format
Tracy - interactive usage - works with Tracy standalone application
NVTX - converts our carb profiler zone annotations into NSight-specific zone annotations, can be read by the NSight Profiler
This UI only supports CPU Mode - Tracy mode does not appear in this UI and is accessed via the omni.kit.profiler.tracy extension. The NVTX mode is not currently from this UI (see developer docs for more details on accessing)
Python Profiler (cProfile)
This is a standard Python cProfile profile. It will record a .prof file containing a python cProfile trace This can be viewed in a cProfile viewer such as snakeviz. Note that it can have a significant performance impact.
Files are output in a pattern like:
cProfile_${TIMESTAMP}.prof
The “stats” output summary that we see (see Captured Traces Browser for how to generate) looks something like this
Tue Jul  4 12:25:38 2023    /home/eoinm/.nvidia-omniverse/logs/Kit/Code/2023.1/traces/cProfile_2023-07-04T12-25-34.prof

102855 function calls in 0.843 seconds

Ordered by: internal time

ncalls  tottime  percall  cumtime  percall filename:lineno(function)
   485    0.229    0.000    0.229    0.000 {built-in method omni.hydra.engine.stats._stats.get_mem_stats}
   429    0.055    0.000    0.398    0.001 texture.py:324(on_drawable_changed)
   429    0.053    0.000    0.053    0.000 api.py:369(_conform_projection)
  1419    0.040    0.000    0.049    0.000 __init__.py:79(_get_stage)
   429    0.031    0.000    0.031    0.000 display_delegate.py:72(size)
   429    0.022    0.000    0.342    0.001 widget.py:425(__set_image_data)
   485    0.017    0.000    0.319    0.001 profiler.py:940(_on_update)
   485    0.016    0.000    0.032    0.000 profiler.py:761(_update_gpu_nodes)
   429    0.016    0.000    0.091    0.000 api.py:403(_sync_viewport_api)
   485    0.016    0.000    0.048    0.000 profiler.py:742(_update_multi_gpu_nodes)
   429    0.015    0.000    0.030    0.000 __init__.py:1122(__make_update_info)
  1287    0.014    0.000    0.084    0.000 __init__.py:935(_update_stats)
   485    0.014    0.000    0.248    0.001 profiler.py:877(_update_memory_stats)
   429    0.014    0.000    0.014    0.000 __init__.py:66(_get_background_alpha)
  6790    0.012    0.000    0.012    0.000 {method 'format' of 'str' objects}
  1287    0.012    0.000    0.012    0.000 __init__.py:172(visible)
   429    0.011    0.000    0.042    0.000 display_delegate.py:68(update)
omni.kit.profile_python
This is a separate extension - it’s functionality will only be available if it is loaded.
This uses python’s sys.setprofile functionality to automatically emit carb::profiler zones on each function call. It is only available once the CPU Profiler is active, and writes to the same chrome trace file. Note that it can have a significant performance impact.
- Example output
- python-carb_trace_output.json
  [
      {
          "name": "Py::log_verbose",
          "cat": "profiler",
          "tid": 61863,
          "ph": "X",
          "pid": 61863,
          "ts": 4.5692132026266927E8,
          "dur": 1.6436537914518922E1,
          "args": {
              "file": "<unknown>",
              "line": 58
          }
      },
      {
          "name": "Py::register",
          "cat": "profiler",
          "tid": 61863,
          "ph": "X",
          "pid": 61863,
          "ts": 4.5692130406103396E8,
          "dur": 3.9284285757339674E1,
          "args": {
              "file": "<unknown>",
              "line": 103
          }
      }
  ]
GPU Profiler
This gives some basic profiling output in the Live Output Section of the Windows.
There are a couple of caveats related to both GPU profilers:
GPU profilers are a different subsystem to the carb.profiler, their output does not go to the “captured traces” folder.
We may have multiple GPUs on a machine running the Kit App we are profiling, but the system profiles only 1 GPU at a time.
perfSDK GPU Profiler
This emits additional profiling data using NVIDIA GPU Performance Counters, see perfSDK for more info.
It may require elevated privileges - see permission-issue-performance-counters for more information
Pixar Trace Profiler
This is a profiler written by Pixar as part of the USD project. It’s similar in scope to the carb::profiler in that it’s main job is to emit timing information about instrumented functions in the code (in this case the USD and Hydra parts of the Kit software stack).
See Pixar USD Docs for more info
It’s completely separate from the other profilers in this extension.
It writes to a separate file (pxr-trace.json in the chrome trace format) stored in the current working dir. The file will be written (and the output displayed in the console) when the profiler is toggled off.
Format looks like this
pxr-trace.json[ { "cat": "Default", "libTraceCatId": 0, "pid": 0, "tid": "Main Thread", "name": "omni::usd::UsdContext::Impl::hydraRender", "ts": 18622411104.959, "ph": "X", "dur": 1094.52 }, { "cat": "Default", "libTraceCatId": 0, "pid": 0, "tid": "Main Thread", "name": "omni::usd::UsdContext::Impl::render (Unlock USD)", "ts": 18622411118.822, "ph": "X", "dur": 5.398 } ]
A Note on the chrome trace format
The Chrome trace format (See Chrome Trace Spec for a full specification ) is used by many of the profilers discussed here.
The trace files can be opened in a number of native and web-based applications, including the chrome browser itself (type “chrome://tracing” into the address bar).
These files are in JSON format, which is easy to read and parse but not very efficient for large amounts of data. For a reasonably long Kit profiling session, it’s very easy to generate files which are too big to open in most chrome trace readers.
For these cases, we recommend using the import-chrome executable which ships with Tracy to convert them to the more efficient Tracy binary format
Navigating the Profiler Window UI
The top of the profiler Window contains several different controls, we will explain the function of each one
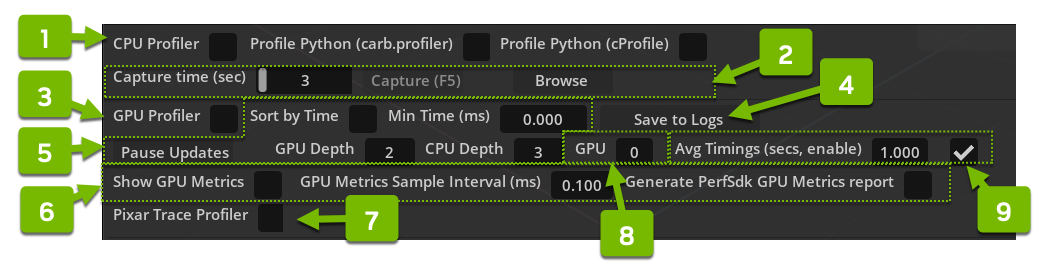
CPU Profiler Controls (1)
CPU Profiler - enable/disable the main carb::profiler CPU Profiler (you will immediately see additional metrics in the Live Output Section)
Profile Python (carb.profiler) - enable/disable the “child” profiler which adds instrumentation of python functions to carb::profiler
Profile Python (cProfile) - enable/disable the CProfile Profiler. Note that only 1 python profiler can be active
CPU Profiler Capture Controls (2)
Capture time(sec) - Adjust capture duration for any or all of the 3 profilers above (Capture starts when the Capture button is pressed)
Capture button - manually start/stop capture.
Browse button - see Captured Traces Browser below
GPU profiler Controls (3,4,6,8)
GPU Profiler - enable/disable the basic GPU profiler (when enabled you will immediately see additional metrics in the Live Output Section)
GPU - select which GPU profile to display for multi-GPU systems (defaults to 0 which is the only GPU in a single-GPU system)
“Save to Logs” will store a snapshot of the current metrics. That output looks like this:
2023-07-04 03:03:54 [2,533,125ms] [Info] [omni.kit.profiler.window] GPU Profiler (ms):
1.360  RTX Rendering
0.322  Spatial HashGrid: CombineHashmaps
0.167  Spatial HashGrid: EvictEntries
0.126  Cached PT ClearNew
0.104  Update GPU SceneDb AccelStruct
0.054  Draw Primitive
0.019  Copy Texture
0.019  Copy Texture
0.012  Update GPU SceneDb Instances
0.008  Spatial HashGrid: Calculate Voxel Size
0.008  Prepare GPU Scene Instance list
0.001  Prepare GPU Scene Instance Data
0.001  ResourceTransitionReadOnly
0.001  OmniGraph Post Processing

1.361  Total GPU-0 Time
Show GPU Metrics - this enables/disables perfSDK profiling, which will show some additional columns in the Live Output
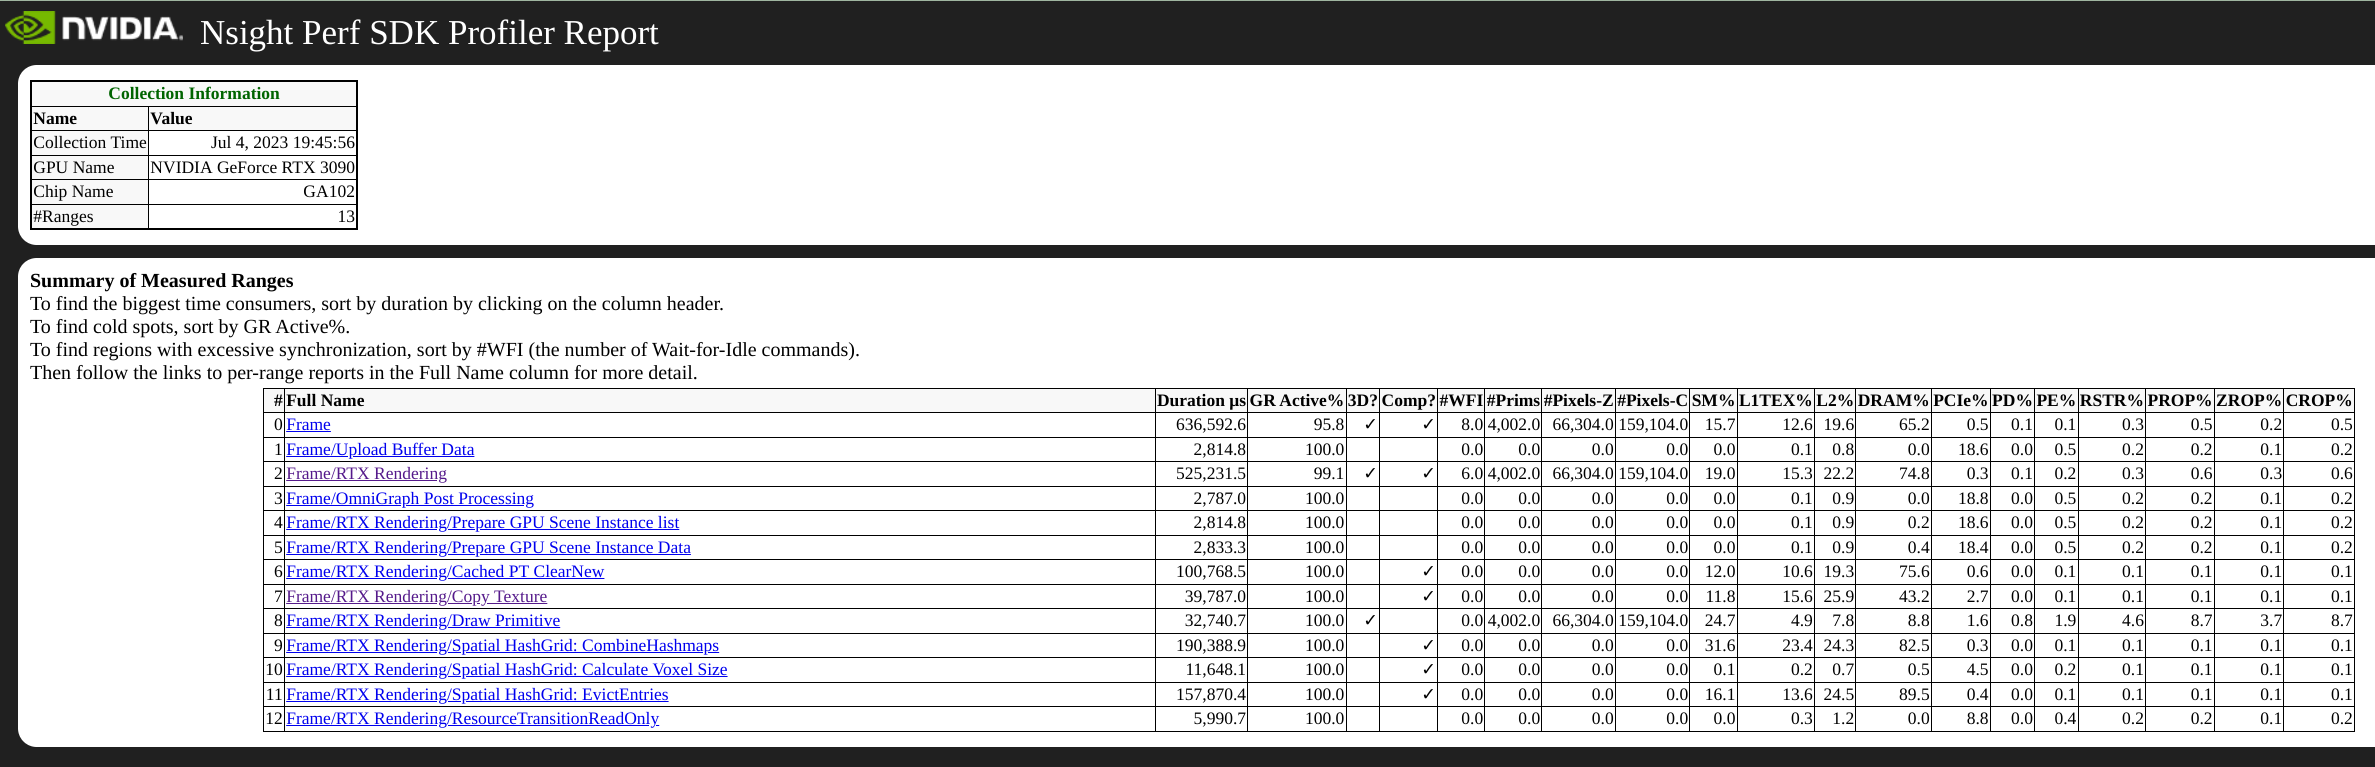
Generate PerfSDK GPU Metrics Report - Checking this and then checking it off again will generate a report like the one below.
The PerfSDK report is generated as a series of HTML files and written to a subdirectory of the Kit log file directory (each report will be inside a timestamped folder). It looks something like this below, and contain a wealth of information about GPU performance
Pixar Profiler Controls (7)
Pixar Trace Profiler - enables/disables the Pixar Profiler which profiles the USD/Hydra part of the Kit stack
Live Output Controls (5, 9)
Allows user to tweak how profile zones measurements based on one or multiple latest frames are displayed below.
Pause Updates - Pauses/Resumes Live updates
Sort By Time - allows to rearrange the events in live update section so that most time consuming events are displayed on top.
Min Time (ms) - set zone cutoff based on zones duration
GPU Depth - increases/decreases levels of nesting of output zones
CPU Depth - increases/decreases levels of nesting of output zones
Avg Timings (secs, enable) - enable/disable and set duration for averaging results across multiple latest frames - this allows for smoother live update display so output jumps around less and is more readable.
Note that live update settings do not affect capture in any way (Capture still records profile zones as they come out from the code directly)
Live Output Section
This is the section at the bottom of the Profiler Window (containing the rows of green text) which show interactive metrics/stats for:
GPU timing (if enabled)
CPU timing (if enabled)
GPU memory (this is always enabled)
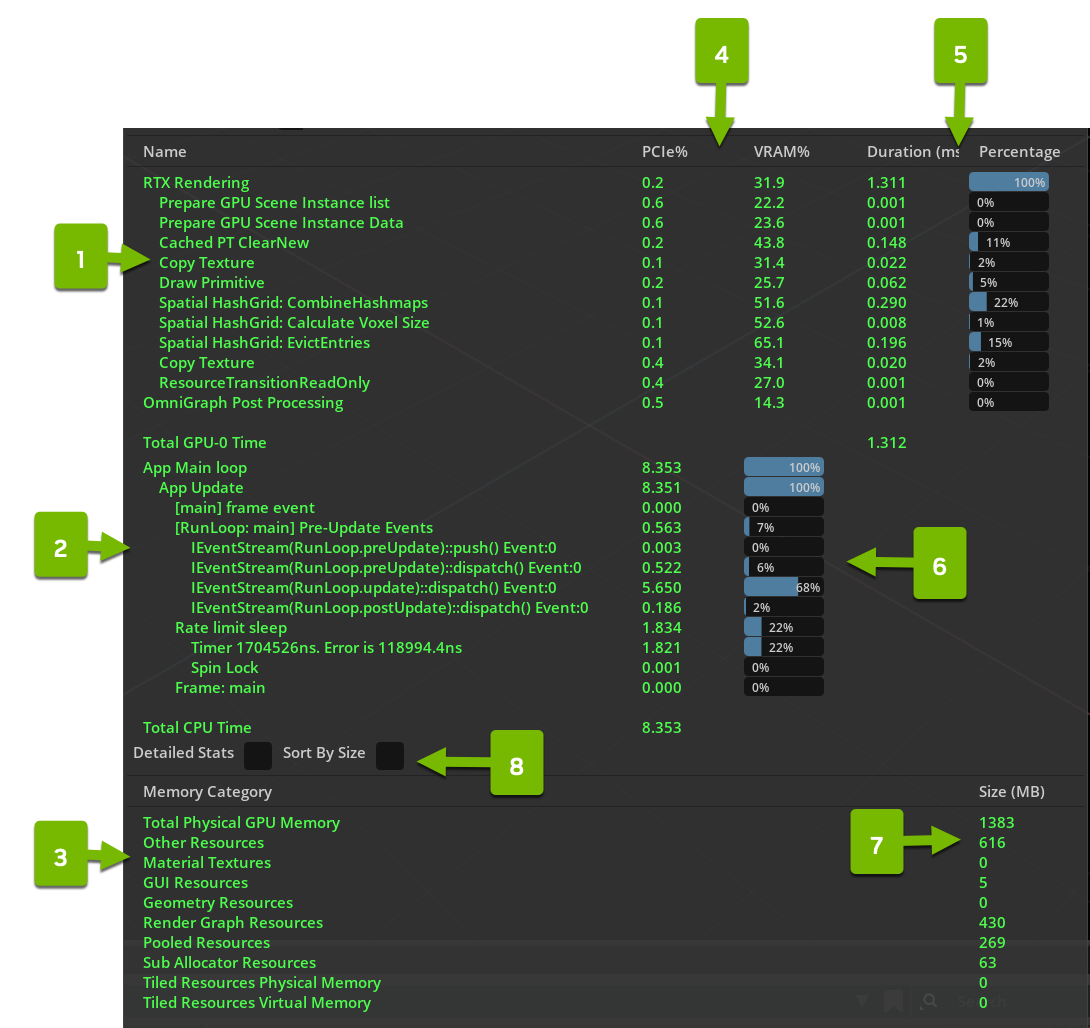
The numbers refer to:
GPU Profiler top times
CPU Profiler top times
GPU Memory breakdown
Additional GPU metrics - available when the “Show GPU Metrics” checkbox is ticked.
GPU profiler durations and percentages - available when the “GPU Profiler” checkbox is ticked.
CPU durations and percentages - available when the “CPU Profiler” checkbox is ticked.
GPU Memory values
GPU Memory controls
Detailed Stats - provide additional nested detail on memory metrics
Sort by size - orders by what is consuming the most memory
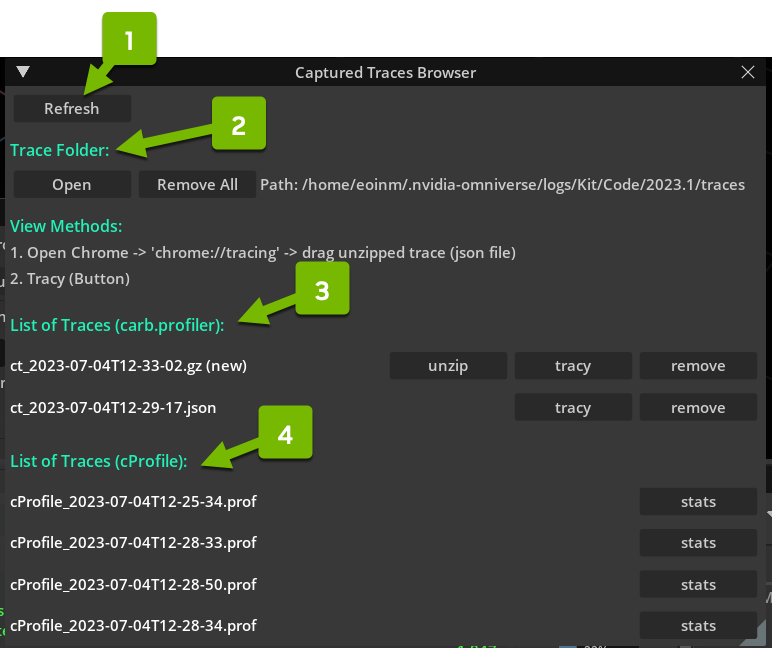
Captured Traces Browser
This is what we see when we click on the “Browse” button in the controls of the Profiler Window
It’s a very simple profile file management UI and contains a few sections.
Top Controls (1)
Refresh - rescans the file system
Trace Folder (2)
Open - Open the folder in web browser
Remove All - delete all trace files from disk
List of Traces (carb.profiler) (3)
unzip - unzip any .gzip files to extract the raw .json
tracy - will convert the chrome trace .json file to tracy format and open it in Tracy (if the omni.kit.profiler.tracy extension is also enabled)
remove - delete the file
List of Traces (cProfile) (4)
stats - open a summary of the prof file in a web browser