VS Code Link#
This tool enables the connection of an Omiverse app to VS Code’s python debugger by using the python ptvsd module. See PTVSD docs and VS Code docs for detailed information on these tools.
Note
The following example assumes you’re familiar with creating an extension and you have VS Code installed. For simplicity, this example will use a new, unmodified Extension Template Project
Enable the required extensions#
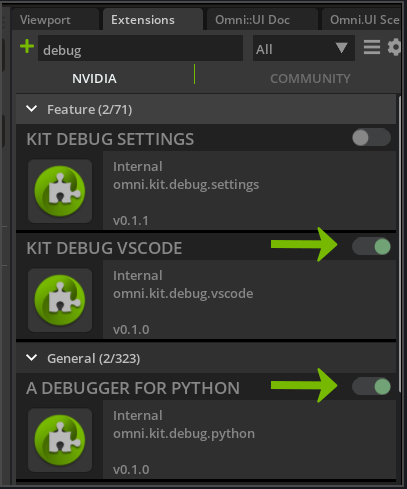
To debug a python extension in VS Code you must first make sure that the Kit Debug VSCode and A Debugger for Python extensions are enabled.
Enter “debug” into the Extensions filter to find them quickly
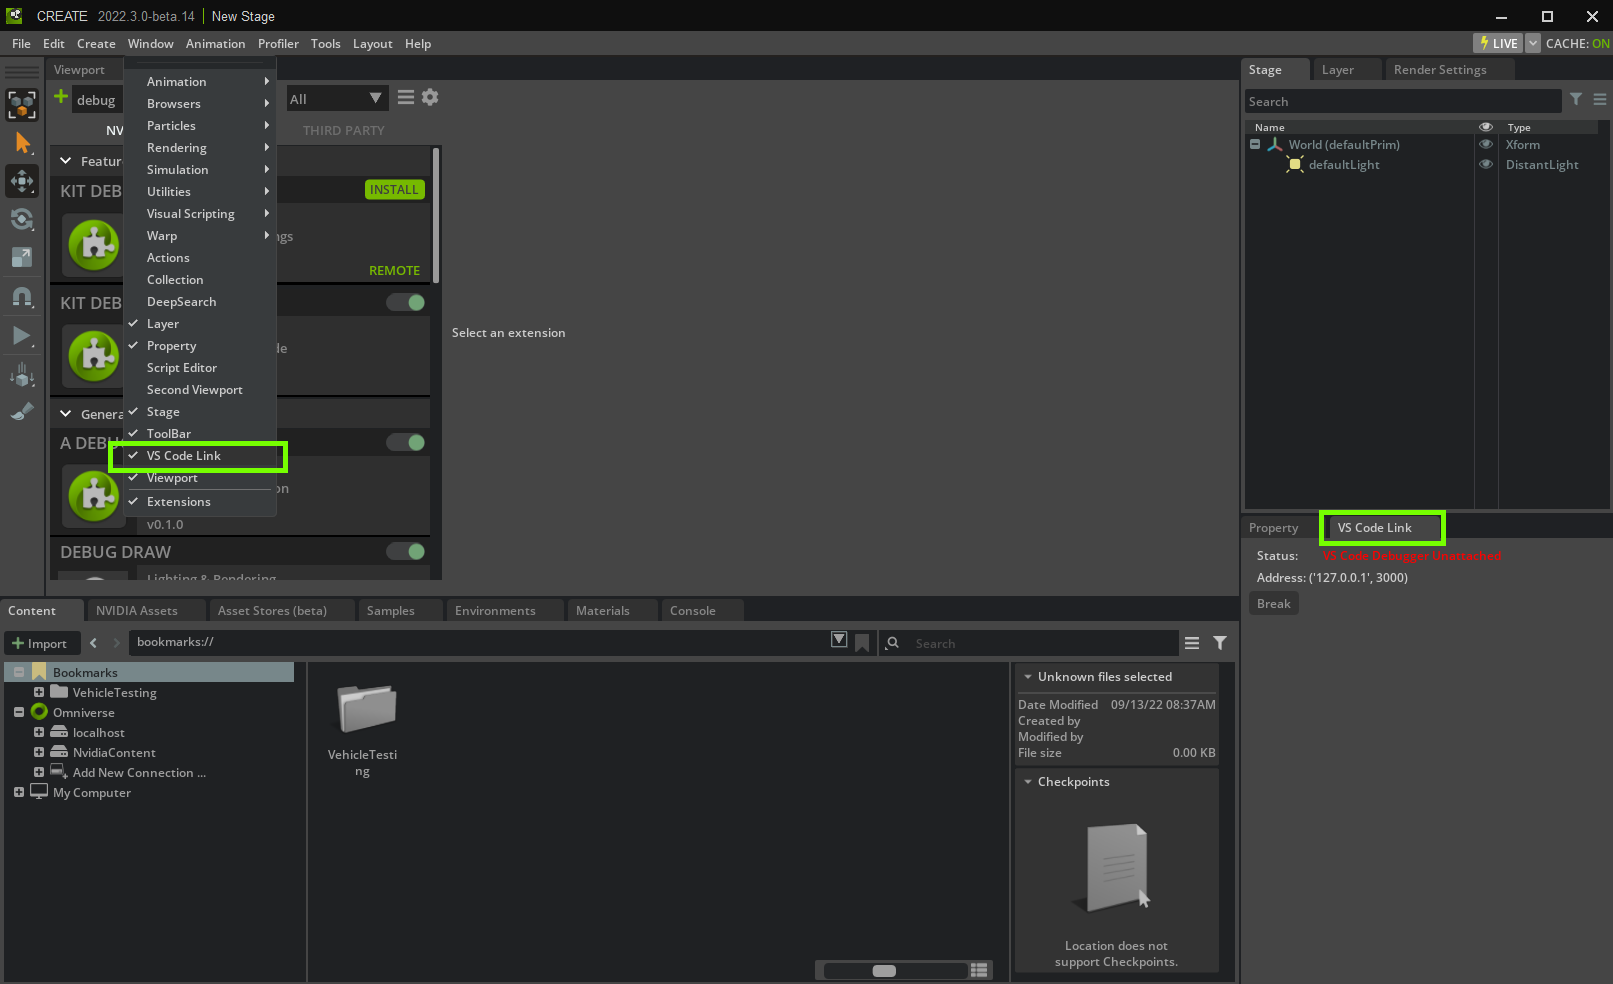
In Omniverse Code, the VS Code Link’s window is located next to the Property window. If you don’t see it, make sure the VS Code Link entry is checked in the Window menu. Notice that VS Code Link currently says it’s unattached (in red).
Configure your project for debugging#
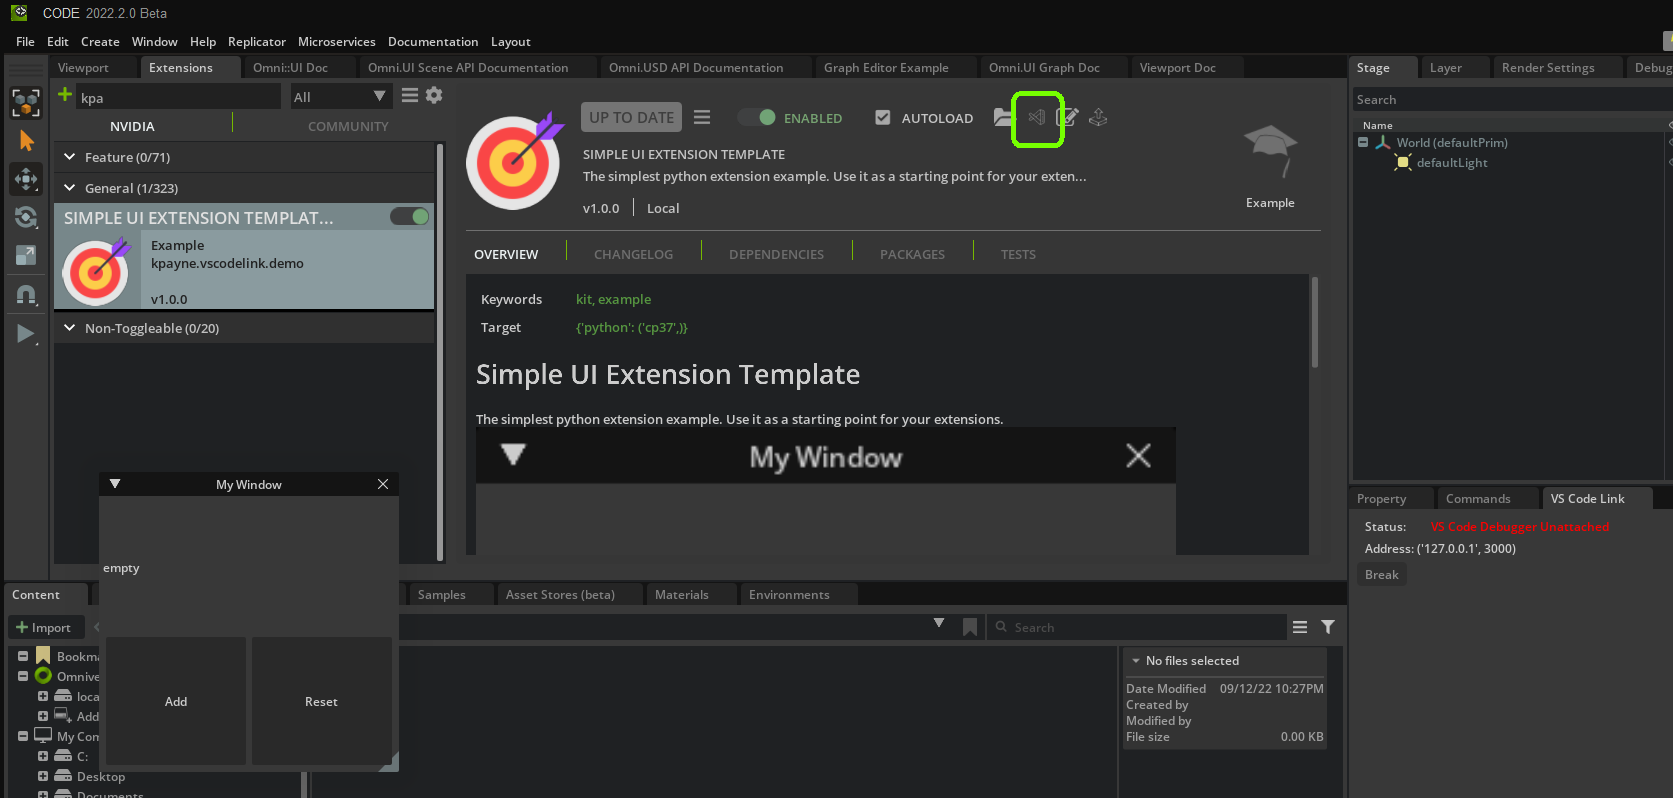
Now open your extension’s project folder in VS Code. An easy way to do this is by having your extension selected in the Extensions window and then by pressing the VS Code icon in the extension information area.
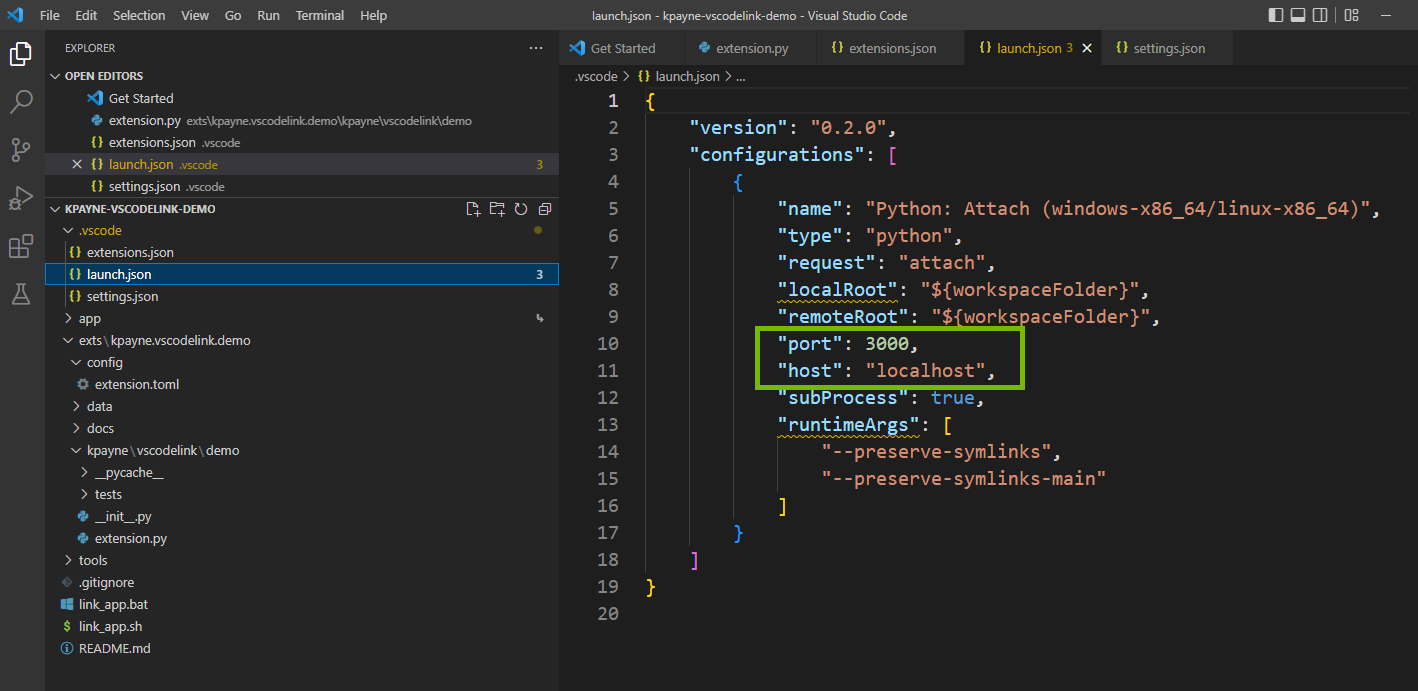
Verify the configuration settings in launch.json are the same as the Address in the VS Code Link window (127.0.0.1 is the same as localhost). The file should look like this, unless it’s been modified.
In the left margin of VS Code, press the Run and Debug button to show the debugger. Make sure “Python Attach” is selected in the debugger configuration drop-down list. This configuration tells the debugger to attach itself to an existing process, since the extension is already running in the Omniverse app.
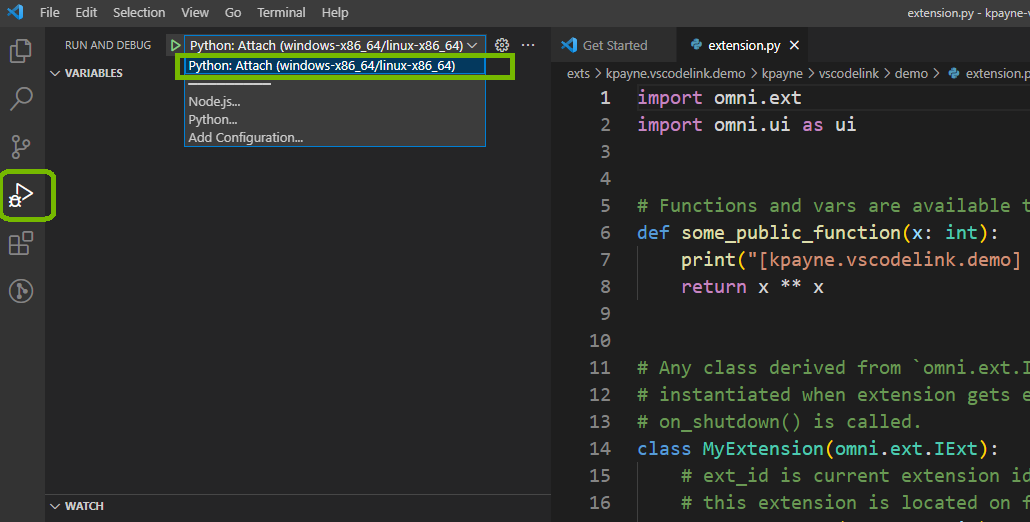
Start the debugger#
Now press the Start Debugging arrow, next to the debugger configuration drop-down list, to start debugging
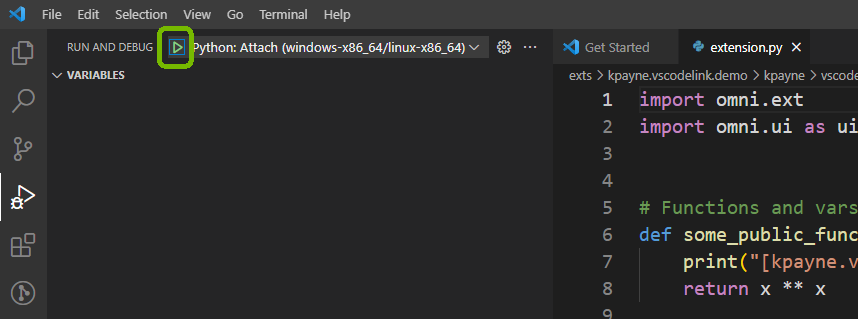
Set a breakpoint#
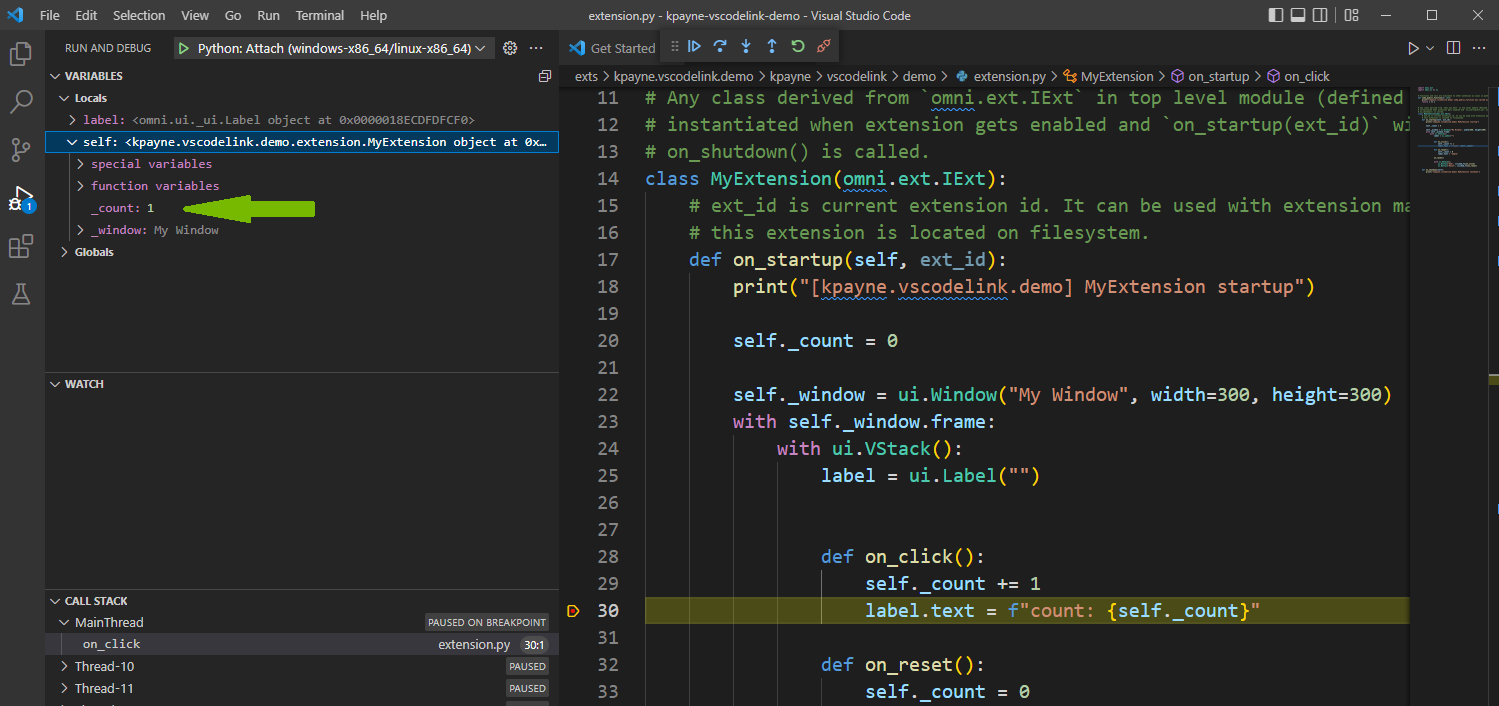
Go to your extension’s extension.py and set a breakpoint that’s easy to verify. You set the breakpoint by clicking in the margin left of the line number (red dot in picture below). In this case the Add button’s on_click(), on line 30, is ideal. This will let _count get incremented before the breakpoint is hit so we can verify the results.
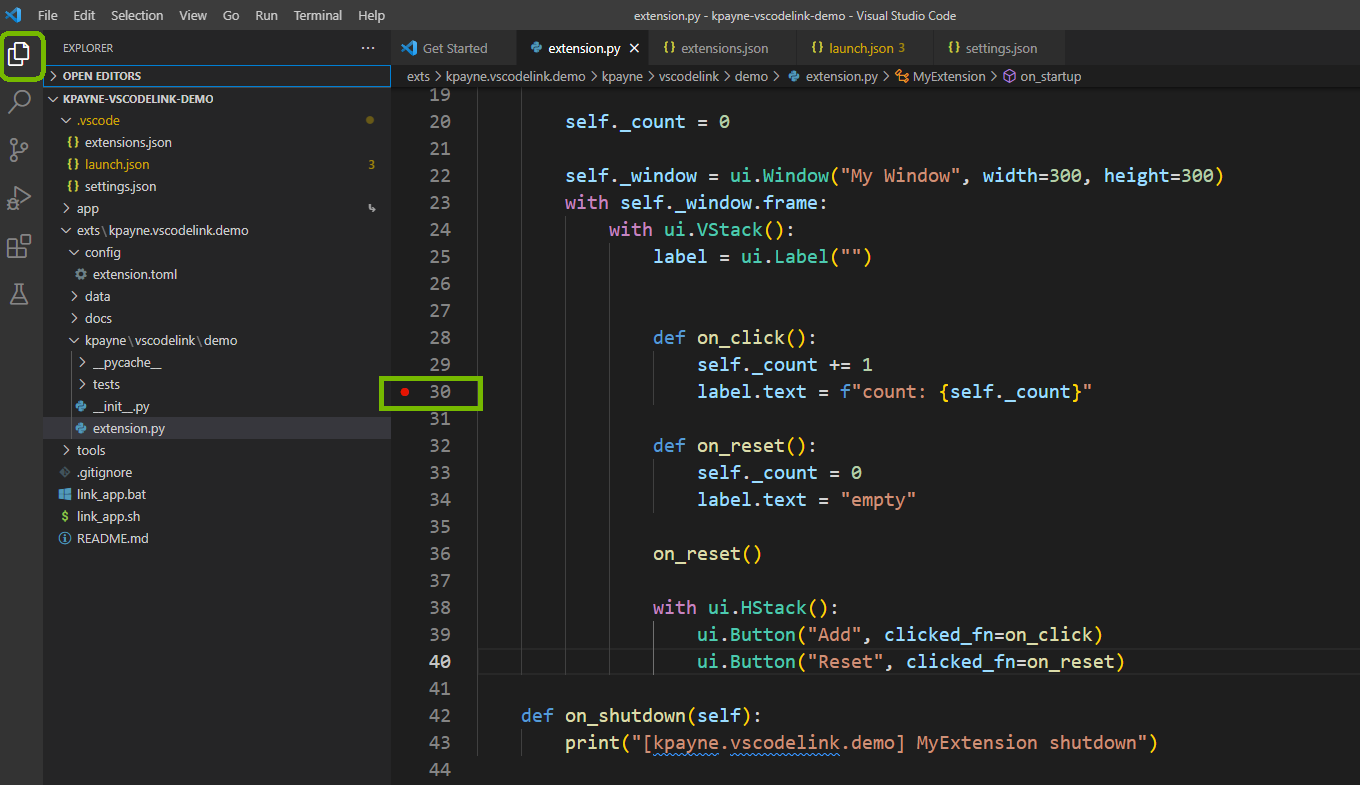
Trigger the breakpoint#
Now go back to your Omniverse app. The VS Code Link window should now say it’s attached.
Press the extension’s Add button. When it is pressed the Omniverse app should stop responding. This is because the breakpoint has paused the execution of the extension’s python code.
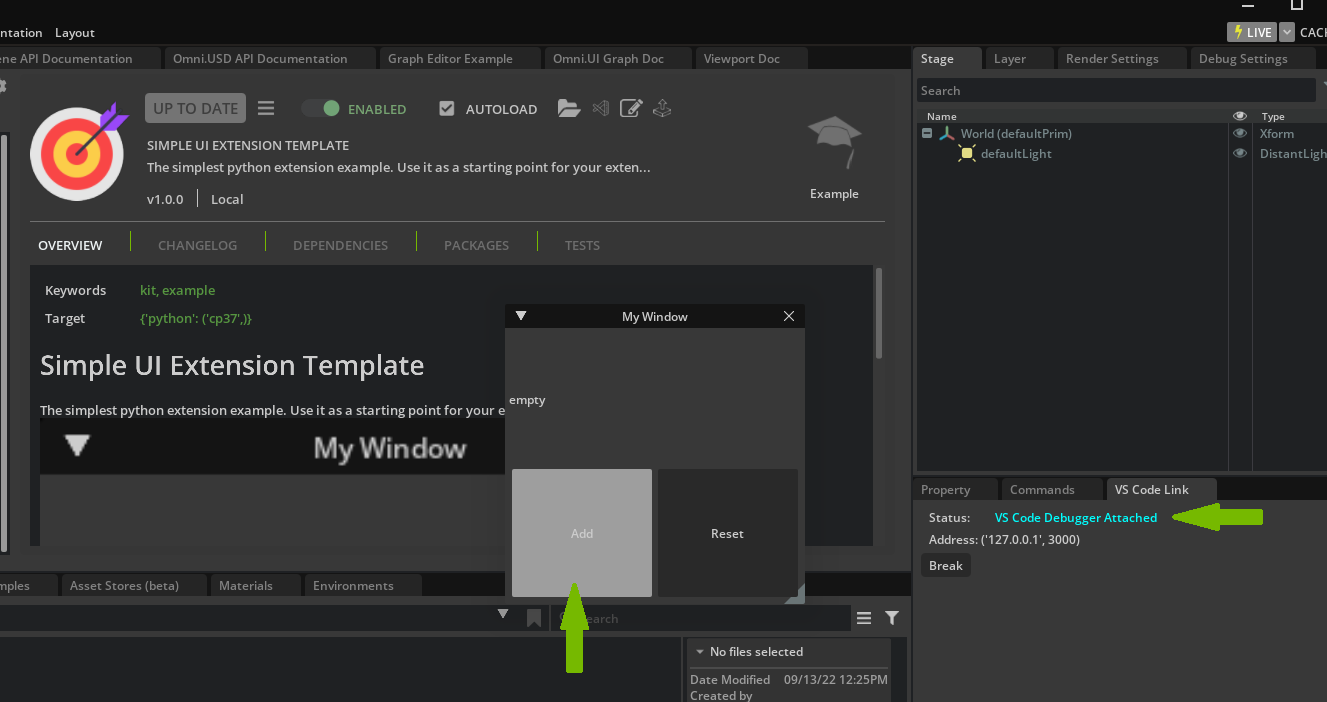
Now go back to VS Code to inspect the results. Notice that _count has been incremented to one (from zero) and the debugger is highlighting line 30 (in this case).
Now your extension is linked to the VS Code debugger and you can use the usual python debugger functions.