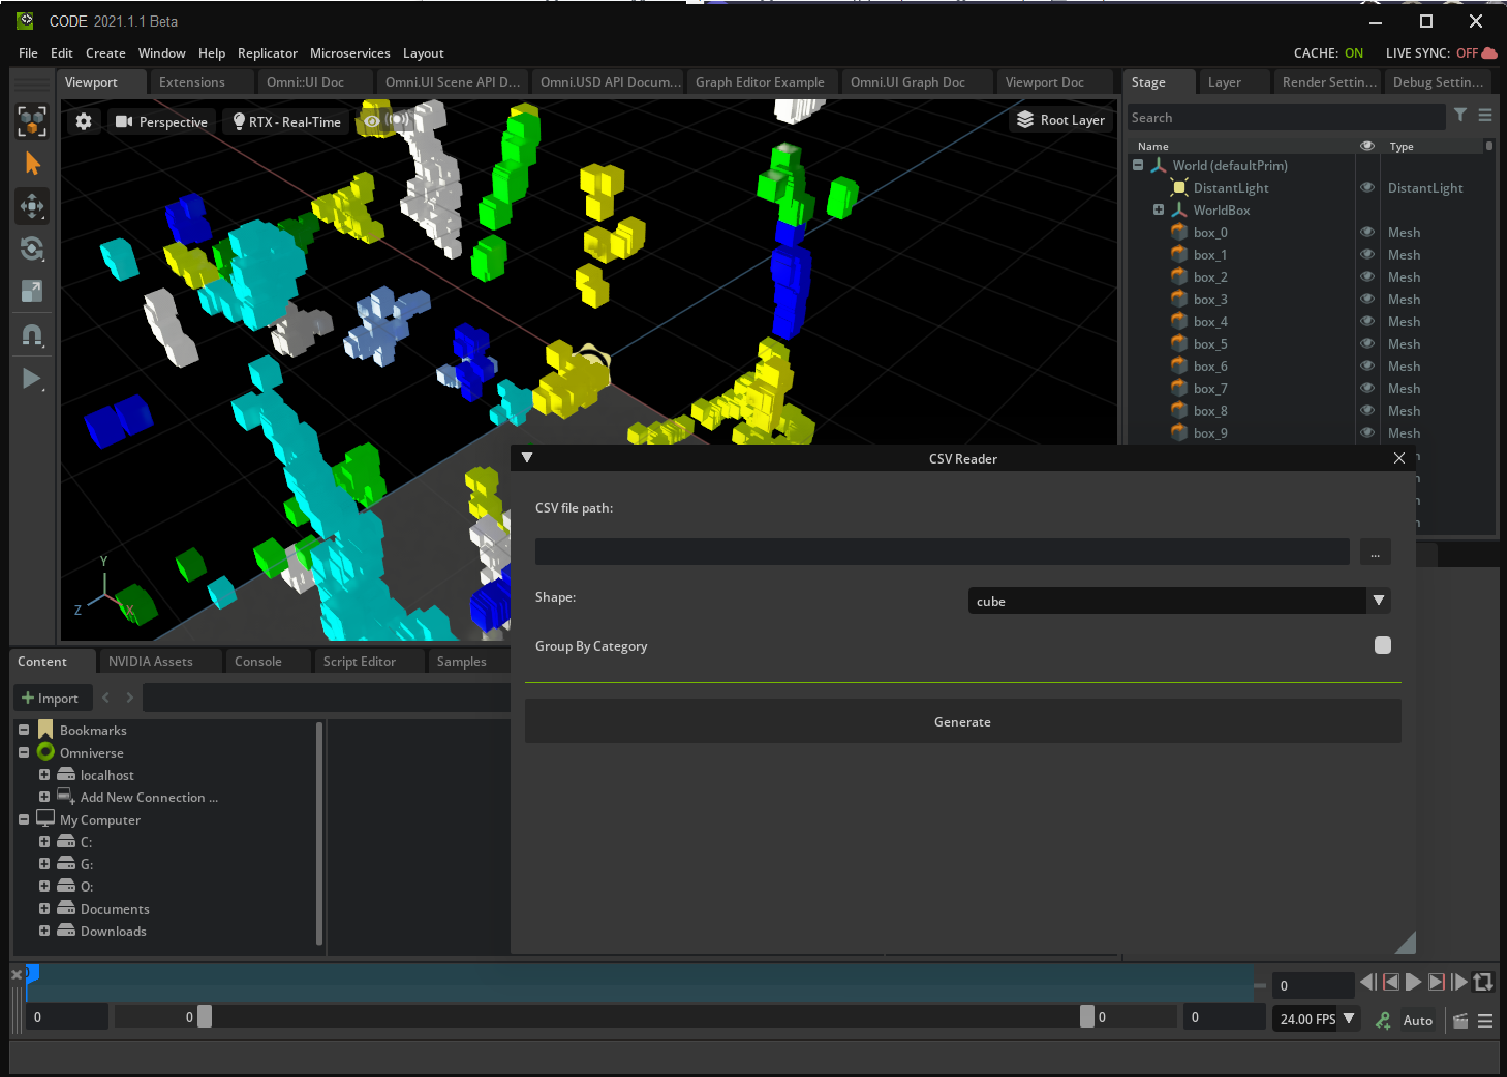
Create a CSV Reader
CSV File, or Comma Separated Values, is the simplest form for storing data/information separated by commas. You can learn more about them in this Wikipedia article. CSV files are commonly used to exchange data of various type and are broadly used. For example, you code CSV data for:
the position of radio antennas and their types spread across one town/region
the position of hotels in Paris and their grade
In this case the CSV file contains X, Y, Z information about the position of some elements to be placed in a 3D environment, as well as a cluster column (representing some extra info), that will be used to color the elements by group.
Learning Objectives
In this guide, you learn how to:
Open a CSV file and read it
Place a prim at an X, Y, Z position given by the CSV File
Create USD references for the prims
Color the prims based on data retrieved from the CSV file
Prerequisites
Omniverse Code 2022.1 or above
Working knowledge of Python
Working knowledge of USD in particular the notion of references
Step 1: Download the Starter Project
In this section, you download and familiarize yourself with the starter project you use throughout this tutorial.
To get the starting code for this hands-on lab, please clone the tutorial-start branch of kit-extension-sample-csv-reader github repository.
git clone -b tutorial-start https://github.com/NVIDIA-Omniverse/kit-extension-sample-csv-reader.git
This repository contains the assets you use in this tutorial.
Step 1.1: Load the Extension
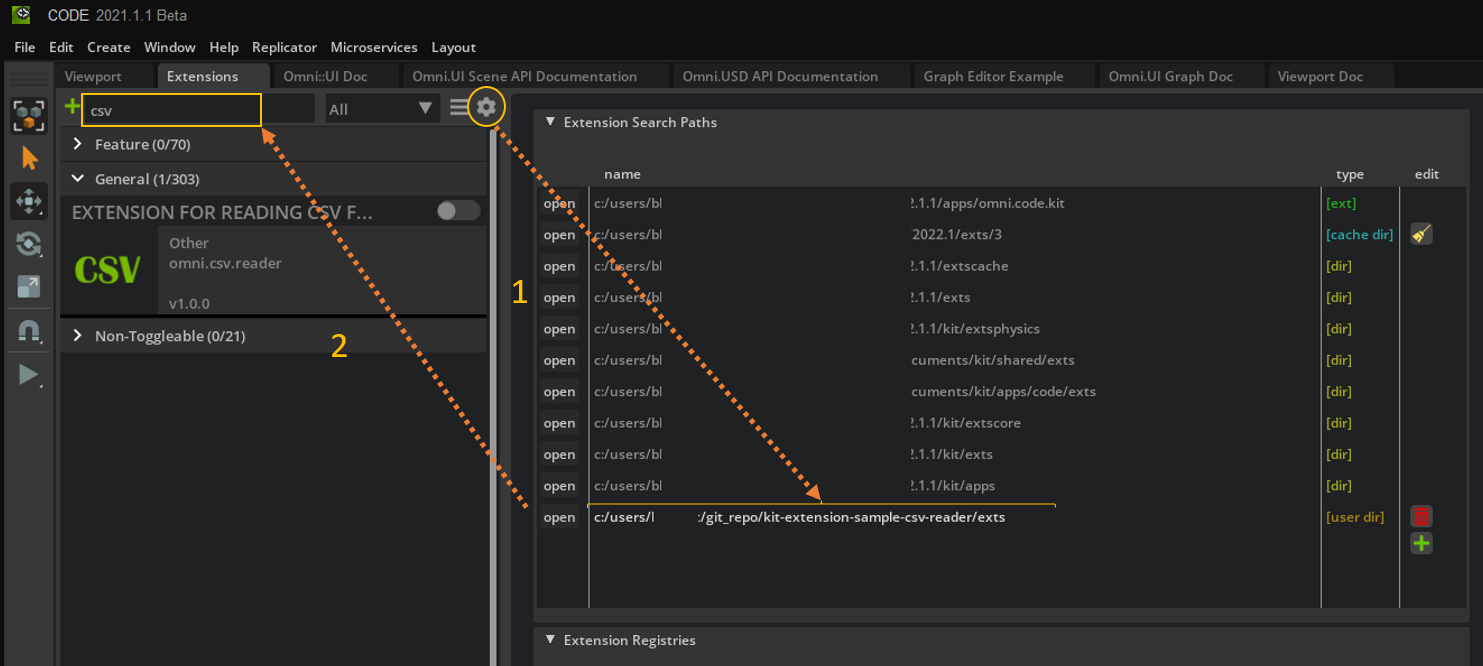
In the Extensions tab, click on the gear. Next, in the extension search path, add the path to the exts sub-folder where you cloned the git repository. Then, search for CSV in the Extensions tab, and enable the extension by clicking on its toggle button.
To learn more about the other files in the repository, please check the Build an Omniverse Extension in less than 10 Minutes, which explains how to create on extension.
Step 1.2: Open models.py
This tutorial will focus on the models.py file found in the exts/omni.csv.reader/omni/csv/reader/ directory, and in particular, on generate(). The starting point of generate() is included below for your reference:
def generate(self):
    # Clear the stage

    # create a new stage with Y up and in meters

    #  set the up axis

    #  set the unit of the world

    # add a light

    # check that CSV exists

        # Read CSV file

            # Iterate over each row in the CSV file
            #   Skip the header row
            #   Don't read more than the max number of elements
            #   Create the shape with the appropriate color at each coordinate

                # root prim

                # add group to path if the user has selected that option

                # create the prim if it does not exist

                # Create prim to add the reference to.

                # Add the reference

                # Get mesh from shape instance

                # Set location

                # Set Color
    pass
Note
CSV Sample Files are provided within the data folder of this extension
Step 2: Prepare the Stage
This section demonstrates how to prepare a stage for shapes to be imported from a CSV file.
Step 2.1: Clear the Stage
The first step is to clear the stage in order to remove any data from previous runs of this tool. This is done with the following code:
def generate(self):
    # Clear the stage
    stage = omni.usd.get_context().get_stage()
    root_prim = stage.GetPrimAtPath(self.root_path)
    if (root_prim.IsValid()):
        stage.RemovePrim(self.root_path)
The first statement gets the current stage. The second statement gets the prim path to the root prim, and if that prim is valid it is cleared.
Step 2.2: Create a New Stage
Next, a new stage is created with the following statements:
# create a new stage with Y up and in meters
if omni.usd.get_context().new_stage() is False:
    carb.log_warn(f"Failed creating a new stage.")
    return

stage = omni.usd.get_context().get_stage()
Here, a new stage is created. If that fails a warning is printed to the console and generate() returns early. Otherwise, the new stage is used going forward.
Step 2.3: Set Stage Parameters
Then, the parameters for the stage are set with the statements below:
#  set the up axis
UsdGeom.SetStageUpAxis(stage, UsdGeom.Tokens.y)
#  set the unit of the world
UsdGeom.SetStageMetersPerUnit(stage, self.stage_unit_per_meter)
stage.SetDefaultPrim(root_prim)
In these statements, the y axis is set to up, the stage units are set to meters, the root prim is set as the default prim. These steps are all necessary so that when you import shapes from a CSV file they have the up-direction you expect, are the correct size, and are added to the correct location within the stage tree.
Step 2.4: Add a light
Finally, a light is added so that the shapes are visible once imported:
# add a light
light_prim_path = self.root_path + '/DistantLight'
light_prim = UsdLux.DistantLight.Define(stage, light_prim_path)
light_prim.CreateAngleAttr(0.53)
light_prim.CreateColorAttr(Gf.Vec3f(1.0, 1.0, 0.745))
light_prim.CreateIntensityAttr(5000.0)
Step 3: CSV file
This section demonstrates how to open and read from a CSV file.
Step 3.1: CSV File Format
CSV Files are a common file format used by data scientists to store data. Two sample CSV files are shown below:
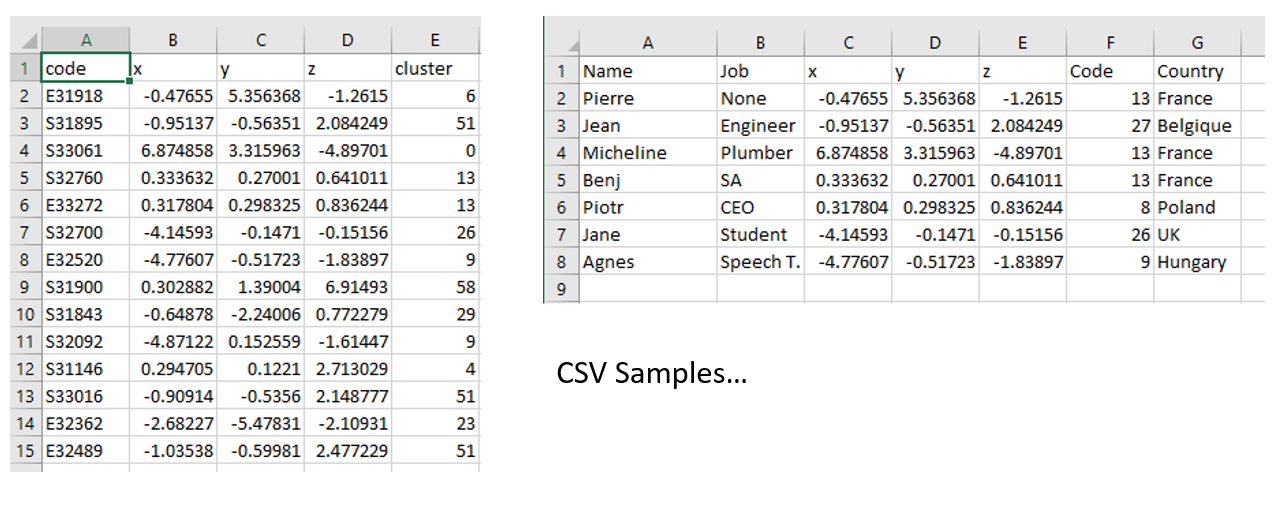
the common format for CSV files contains a header in the first line with names for the different fields and any number of following lines which contain values for each column. Each row represents one element in the list.
The rest of this section will outline how to open and read the data from a CSV file.
Step 3.2: Check that the File Exists
It is good practice to check that a file exists before trying to open it as shown below:
# check that CSV exists
if os.path.exists(self.csv_file_path):
If the file exists, then continue. If not, gracefully exit the routine and preferably notify the user that the file does not exist.
Step 3.3: Read the CSV file
To open and read a CSV file, use Python’s built-in csv module as demonstrated in the following snippet:
# Read CSV file
with open(self.csv_file_path, newline='') as csvfile:
    csv_reader = csv.reader(csvfile, delimiter=',')
    i = 1
Here the file is opened with the open statement and then then csv.reader reads the file’s contents into a list. The iterator, i, will be used later to name each shape.
Step 3.4: Process the CSV file
Each line of the CSV is processed using the following code block:
# Iterate over each row in the CSV file
#   Skip the header row
#   Don't read more than the max number of elements
#   Create the shape with the appropriate color at each coordinate
for row in itertools.islice(csv_reader, 1, self.max_elements):
    name = row[0]
    x = float(row[1])
    y = float(row[2])
    z = float(row[3])
    cluster = row[4]
In the first statement, the itertools module is used to process only the correct rows. islice() will take rows from csv_reader starting at the index 1 (this skips the header) and until the end of the list or self.max_elements, whichever comes first.
The next few statements retrieve the name, coordinates, and cluster id from the given row. If you would like to print out information as it runs in order to debug the code, you could add the following code:
carb.log_info(f"X: {x} Y: {y} Z: {z}")
This would print the coordinates from each row to the console. Remove those lines after validating that reading was successful - no need to keep that kind of debugging in the final code.
Step 4: Create each shape
This section will go through the creation of each shape at the correct location in the correct color.
Step 4.1: Determine the Prim Path
The prim path is determined using the following code:
# root prim
cluster_prim_path = self.root_path

# add group to path if the user has selected that option
if self.group_by_cluster:
    cluster_prim_path += self.cluster_layer_root_path + cluster

cluster_prim = stage.GetPrimAtPath(cluster_prim_path)

# create the prim if it does not exist
if not cluster_prim.IsValid():
    UsdGeom.Xform.Define(stage, cluster_prim_path)

shape_prim_path = cluster_prim_path + '/box_%d' % i
i += 1
First, all prims share the same root so the path of each shape prim is create using the root prim’s path. Second, if the user has selected to have the prims grouped, a group is appended to the path. Next, if that cluster does not exist yet it is created. Finally, the name of the individual prim is appended to the end of the path and the iterator is incremented.
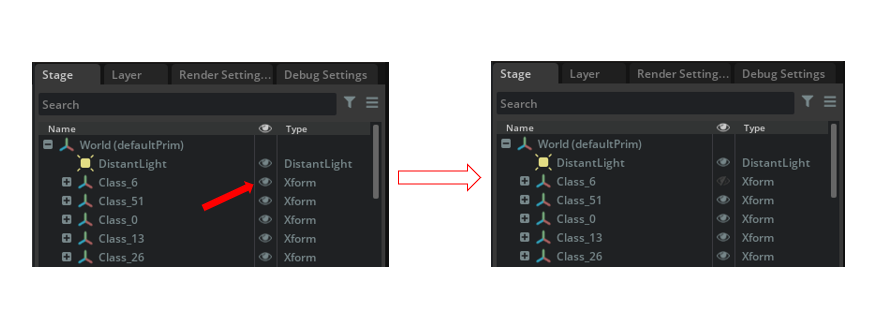
In the code above, prims are grouped if the user has selected the grouping option. Imagine that the cluster refers to the type of object (ie. cluster 6 refers to street lights and cluster 29 to mail boxes). In that situation grouping can be very useful because instead of selecting each street light one by one in the stage scene, their group can be selected instead. This would let a user easily hide/show the entire group or edit the group in some other way.
Step 4.2: Create a Reference
When working with USD scene composition, using a reference helps refer to the same “asset” multiple times. You can read more References in the USD Glossary.
Here, instead of creating one prim per line in the CSV, a single prim is created and then a reference to that shape is made for each line in the CSV. This has several benefits:
If the referred shape is changed, all elements would also change.
If saved, the output file will be smaller
This is done with the following code:
# Create prim to add the reference to.
ref_shape = stage.OverridePrim(shape_prim_path)

# Add the reference
ref_shape.GetReferences().AddReference(str(self.shape_file_path), '/MyRef/RefMesh')
Here the reference is created and then used.
Step 4.3: Set the Position of the Prim
Next, the position of the prim is set as follows:
# Get mesh from shape instance
next_shape = UsdGeom.Mesh.Get(stage, shape_prim_path)

# Set location
next_shape.AddTranslateOp().Set(
    Gf.Vec3f(
        self.scale_factor*x,
        self.scale_factor*y,
        self.scale_factor*z))
In the first statement, you get a UsdGeom.Mesh representation of the prim and assign it to the next_shape variable. In the next statement, it is transformed according to the data read from the CSV file. Note that each is scaled by a constant value. This is simply because the shapes are large relative to the values of in the CSV file and so the translations are scaled up until the shapes are separated by a reasonable amount of space.
Step 4.4: Color the Shapes
Finally, the shapes are colored with this code:
# Set Color
next_shape.GetDisplayColorAttr().Set(
    category_colors[int(cluster) % self.max_num_clusters])
Here, the color display attribute is set on each prim according to its cluster attribute read from the CSV file.
Step 5: Conclusions
The final result should match the block below:
def generate(self):
    # Clear the stage
    stage = omni.usd.get_context().get_stage()
    root_prim = stage.GetPrimAtPath(self.root_path)
    if (root_prim.IsValid()):
        stage.RemovePrim(self.root_path)

    # create a new stage with Y up and in meters
    if omni.usd.get_context().new_stage() is False:
        carb.log_warn(f"Failed creating a new stage.")
        return

    stage = omni.usd.get_context().get_stage()
    #  set the up axis
    UsdGeom.SetStageUpAxis(stage, UsdGeom.Tokens.y)
    #  set the unit of the world
    UsdGeom.SetStageMetersPerUnit(stage, self.stage_unit_per_meter)
    stage.SetDefaultPrim(root_prim)

    # add a light
    light_prim_path = self.root_path + '/DistantLight'
    light_prim = UsdLux.DistantLight.Define(stage, light_prim_path)
    light_prim.CreateAngleAttr(0.53)
    light_prim.CreateColorAttr(Gf.Vec3f(1.0, 1.0, 0.745))
    light_prim.CreateIntensityAttr(5000.0)

    # check that CSV exists
    if os.path.exists(self.csv_file_path):
        # Read CSV file
        with open(self.csv_file_path, newline='') as csvfile:
            csv_reader = csv.reader(csvfile, delimiter=',')
            i = 1
            # Iterate over each row in the CSV file
            #   Skip the header row
            #   Don't read more than the max number of elements
            #   Create the shape with the appropriate color at each coordinate
            for row in itertools.islice(csv_reader, 1, self.max_elements):
                name = row[0]
                x = float(row[1])
                y = float(row[2])
                z = float(row[3])
                cluster = row[4]

                # root prim
                cluster_prim_path = self.root_path

                # add group to path if the user has selected that option
                if self.group_by_cluster:
                    cluster_prim_path += self.cluster_layer_root_path + cluster

                cluster_prim = stage.GetPrimAtPath(cluster_prim_path)

                # create the prim if it does not exist
                if not cluster_prim.IsValid():
                    UsdGeom.Xform.Define(stage, cluster_prim_path)

                shape_prim_path = cluster_prim_path + '/box_%d' % i
                i += 1

                # Create prim to add the reference to.
                ref_shape = stage.OverridePrim(shape_prim_path)

                # Add the reference
                ref_shape.GetReferences().AddReference(str(self.shape_file_path), '/MyRef/RefMesh')

                # Get mesh from shape instance
                next_shape = UsdGeom.Mesh.Get(stage, shape_prim_path)

                # Set location
                next_shape.AddTranslateOp().Set(
                    Gf.Vec3f(
                        self.scale_factor*x,
                        self.scale_factor*y,
                        self.scale_factor*z))

                # Set Color
                next_shape.GetDisplayColorAttr().Set(
                    category_colors[int(cluster) % self.max_num_clusters])
This tutorial has demonstrated how to read a CSV file and use its data to place shape prims in a scene. Rather than place many unique shapes, the tutorial used references to place copies of the same shape. The shapes were located and colored based on data in the CSV file.