Simulation Data Visualizer Window#
Understanding how data changes overtime is important to fully analyze data and identify issues. By enabling the Omni Physics UI extension, you get access to the Simulation Data Visualizer window, which allows you to visualize the data by plotting graphs of a physics object’s properties during simulation.
The feature is toggled through the viewport eye menu, for example:
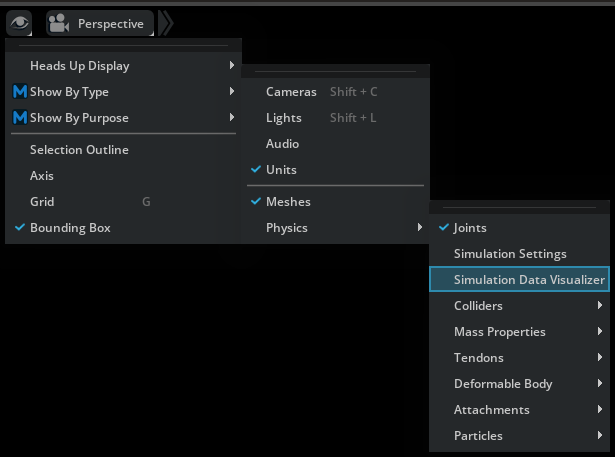
When enabled, a Simulation Data Visualizer window will appear docked in the bottom window group section.
By default, the window targets the currently selected prim or, if multiple prims are selected, the prim most recently added to the selection. However, it is possible to lock the window to a given prim by pressing the lock button:
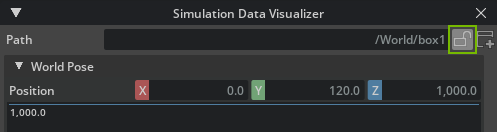
When the window is locked, it will keep targeting the same prim even as the current selection changes.
You can also create new Simulation Data Visualizer windows by pressing the new button:
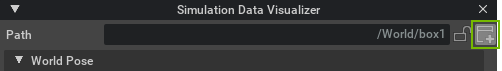
Combined with the ability to lock windows, this enables you to monitor several prims at the same time by having multiple Simulation Data Visualizer windows open.
Note
When creating a new window, it will automatically set the old window to the locked state.
Inspecting and Exporting Data#
The currently active simulators determine what data is available for the target prim, and may depend on whether the simulation is running or not (in the images below, only the PhysX simulator is active and simulation is running)
The individual data entries will appear as either a single floating point value, 3D vector (with magnitude), 3D point, axis-angle rotation, boolean, integer, or a text string. If you hover the entry, a tooltip will show the documentation for it.
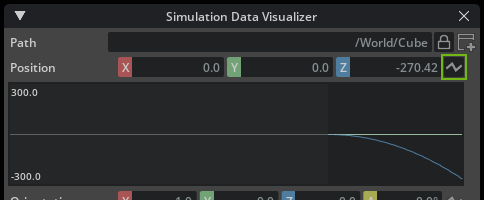
For entries with values in the form of floating points, 3D vectors, 3D points, and axis-angle rotations, the data will be visualized in graphs, which can be toggled by clicking the graph button next to the data entry.
For the multiple component data types, you may further toggle each of the subcomponents by left-clicking their respective label button:

In addition, you may also right-click a component, which will enable the display of that specific component and hide all other.
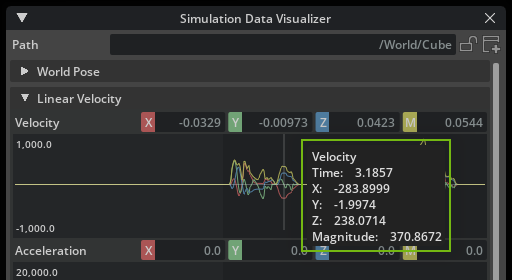
After the visualizer has plotted data in a graph, you can inspect the values at a specific data point by pressing the left mouse button while hovering it.
And finally, if you right click the graph, all the samples for that plot will be copied to the clipboard in comma separated values format (CSV) that allows you to paste it into other database programs.